Simulation with AnyLogic/Discrete Event Simulation/Bank Model/Step 4. Collecting utilization statistics
Step 4. Collecting Utilization Statistics
With AnyLogic, you can collect complicated statistics whenever you need them. The objects of the Enterprise Library are already capable of collecting the basic statistics. All you need is to turn the statistics collection for the object on, as it is disabled by default to speed up the model execution. Since we have already done this earlier, now we are ready to view the statistics collected for the flowchart objects with charts.
We want to observe how mean ATM utilization and mean queue length change with time.
![]() Add a bar chart to indicate mean ATM utilization
Add a bar chart to indicate mean ATM utilization
- Open the Analysis stencil of the Palette view. This stencil contains charts and data objects used for collecting data and performing various statistical analysis on them. Drag the Bar Chart
 element from the stencil into the graphical editor and then resize it.
- Go to the Properties of the chart. Click Add Data Item to add data item to be displayed by this chart.
- Modify the data item's Title: ATM utilization.
- Type ATM.statsUtilization.mean() as the Value of the data item. Here ATM is the name of the Delay object we created. Each Delay object has statsUtilization data set that collects statistics on the object utilization. The mean() is the function that returns the mean value measured. You can use other methods to get statistical values, such as min() and max(). You can find the list of all the methods on the StatisticsContinuous page.


![]() Add a bar chart to indicate mean queue length
Add a bar chart to indicate mean queue length
- Add one more bar chart in the same way. Resize it to look like the one in the figure.

- Open the Appearance tab of the Properties view and choose the first option from the Bars Direction section to make bars grow to the left.

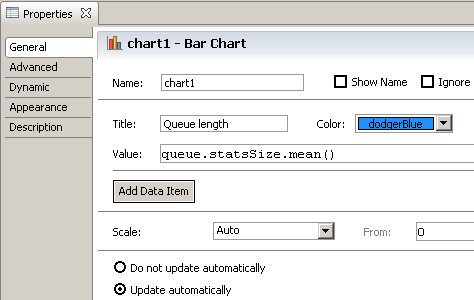
- Add a data item to be displayed by the chart. Set Title: Queue length and Value: queue.statsSize.mean() Here statsSize is the data set of type StatisticsContinuous that collects the statistics on the Queue size.


Run the model and observe the ATM utilization and mean queue length with just created charts.
