Using SPSS and PASW/Paired Samples t-test
A paired samples t-test is a test that is useful when you have two interval/ratio variables from the same people in a sample that are measured exactly the same way. You can use a paired samples t-test to compare the scores on the two variables. The most common use of this test is for pre- and post-test scores for a sample when they are exposed to some intervention in between the pre- and post-tests. The reason a paired samples t-test is used instead of an independent samples t-test is because the scores are for the same people, which suggests there is an underlying relationship between the scores.
Another time paired samples t-tests are useful is when you have two variables with the same units of measure from the same subjects from the same time and you want to see if the subjects score differently on one test compared to the other. This is the example we will use in this chapter to illustrate the test. In the sample data set of genetic counselors, there are two interval variables that have the same unit of measure - a 10 point scale. However, one variable asked genetic counselors how religious they were and the other asked them how spiritual they were. Since it is the same subjects being asked different questions that use the same metric, we can compare their scores on these two variables using a paired samples t-test.
Here's how this is done in SPSS. To begin with, select "Analyze" -> "Compare Means" -> "Paired-Samples T Test":

The "Paired-Samples T Test" window will open:

To select the variables to compare, you have to actually select two variables at the same time. To do this, select the first variable, then hold down "Control" and select the second, then move them over to the "Paired Variables" box with the blue arrow:

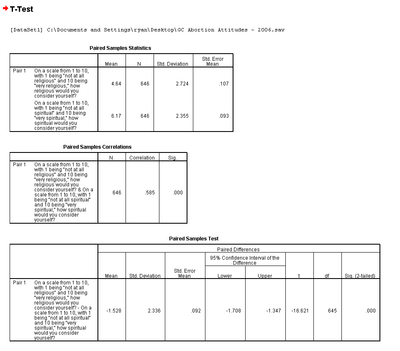
Then hit "OK." You'll get the following tables in the Output Window:

The first table provides basic sample and variable statistics for the two variables, including the Mean, the sample size, the Standard Deviation, and the Standard Error of the Mean. Of interest in our comparison are the two means. On the spirituality scale, genetic counselors report a mean of 6.17. On the religiosity scale, genetic counselors report a mean of 4.64. Those appear to be quite different scores, but the question of interest is whether those scores are different due to chance or due to an actual affect in the population. The paired-samples t test allows us to determine that.
The second table, a correlation table, is discussed in the chapter on correlation, so it will not be discussed here.
The third table is the "Paired Samples Test" table. The first column is labeled the "Mean" and it is the average difference between the two variable means. The "Std. Deviation" and "Std. Error of the Mean" are calculated on the average mean in the first column. Columns four and five are lower and upper confidence intervals for the difference. For more information on confidence intervals, see the chapter on confidence intervals. The sixth column, "t", is the t-score. The seventh is the degrees of freedom. The eight column provides the p-value for the difference of means. In our example, the p-value is .000, which is less than a standard alpha of .05, indicating that the odds of these two scores being different due to random chance assuming they are actually the same is less than 1 in 1000. In this case, we would reject the null hypothesis that they are the same and accept the alternative. There is a significant difference between the religiosity and spirituality of genetic counselors; genetic counselors are significantly more spiritual than they are religious.