Transportation Deployment Casebook/2020/California Streetcar
California due to its exceptionally complicated and challenging topography is a region of extremes. With the gold rush starting from 1847,[1] gold mining became an important factor of economy, this also bought in the economy for agriculture and Cattle ranching factored by the difficulty in bringing supplies from the west side of California on account of no rail link. Thus area in east California was left out. First Transcontinental Railroad in 1869[2] to California ended its physical isolation from the rest of the United States. This saw large numbers of people coming to California. The mass transport modes were not in place, the destinations in cities were mostly reached by walking, the rich people had wagon or carriages.
The first form of streetcars deployed in California were the horse-driven streetcars on unpaved surfaces. As the existing roads at that time were generally poor, ride on the road was slow and bumpy, especially in poor weather conditions difficult to operate.
Early period
editThe history of the development of streetcar in America started from the 1820s. The earliest city street railways consisted of streetcars drawn by horses and sometimes mules on track. The streetcars pulled by horse or mule on rails improved the comfort, speed and efficiency of operations as there is less rolling resistance on a rail in comparison to roads. The first streetcar in San Francisco in 1860 started was operated by steam dummies, later by horses.[3]
Beginnings
editThe uneven terrain of parts in California made it difficult for a horse-driven street cart to operate. This paved the way for the cable pulled streetcars.
The operation of cable cars is done through a stationary engine which pulls the cable throughout Rail-line. The Grip cars by gripping the moving cable in line tow trailer cars, for stopping the grip car un-grips the cable. Cable Pulled Street Cars offered greater Speed, Safety and Cleanliness Improvement (horse faeces) over horse-driven streetcars.
The high upfront cost for building and high operation cost made cable railway system unattractive. Further, the cable systems were not scalable as were the other evolving technologies.
The electric propulsion was explored, the initial electric cars developed were capable of transporting people quickly, but technical problems, breakdowns delayed the service frequently. Technological and design improvement in electric streetcars made the deployment of successful large electric street railway system possible. This made major streetcar systems to shift to electric and attracted electric utility companies to jump in for streetcar operation.[4]
As the system grew larger and demand increased for the services, the frequency of operation also increased, the time tables also evolved, which were placed for the general public and operational convenience.
Market Development
editBefore Streetcars in California, the urban areas were small, Cities started expanding due to increased mobility from streetcars, now people could settle or make houses over larger distances from the centre of the Town and still be able to reach their jobs and downtown businesses as required. This benefitted real estate development and residents.
Polices
editIn California the birthing phase started from the 1860s, the policies were already in place for the rail road and the same were emulated to streetcars.
- The construction policies were borrowed from the construction techniques of Railroads.
- Common carrier model for freight and passengers was taken from canal services
- The formation of the timetable for coordination to ensure reliability and safety in operation.
The Governments of the times were pro Rail roads, and thus issued charters for development of railroad considering safety , service and fares.[5] Also, few other policies were locked in in this period, for example, the width of the track was made standard as 4 feet 8 1/2 inches for track gauge. The narrow gauge streetcars died and were converted to standard gauge.
Decline
editIn 1914 world war-I started due which the business was impacted and the ridership may have also declined. By 1920s the streetcar system in California reached its maturity and started losing its popularity owing to the deployment of buses and automobile. The automobile was an attractive option as against the streetcars, they provided better speed, comfort, the convenience of going anywhere the people desired. Even though the new improved streetcar featuring automobile-style controls, fast acceleration and deceleration were fast to come, however, the new streetcars were not able to compete with the automobile.
Quantitative Analysis
editThe life cycle analysis for most of the transport mode follows the S-Curve representing the birthing, growth and maturity phases. The logistic relationship for the lifecycle can be defined by the equation
S(t)=K/(1+e^((-b(t-to)) )
where:
- S(t) is the status measure, (streetcar track miles)
- t is time (year),
- t0 is the inflection time (year in which 1/2 K is achieved),
- K is saturation status level for streetcar track miles,
- b is a coefficient.
The above equation can be rearranged to obtain a linear relationship with t( Time )as :
ln(S(t)/(K-S(to) ))=b×t+c
Where c =-b/to
Comparing it with Y= bX+c
This three-parameter function is required to be solved for K, b and c. The value of K is assumed and linear regression analysis for values of time (t) as X parameter and Ln( s(t)/(K-s(to))) as Y parameter is done using Microsoft Excel to find the intercept and slope by best-fitting model, the Solver tool is employed to maximise the value of RSq nearest to 1, t-statistics more than 2.
In the instant case, the track miles of the streetcars in California U.S. is analysed with time(year). The data for the streetcar track miles for the state of California was obtained from “McGraw electric railway manual - the red book of American street railway investment” [6] from the year 1894-1920 however the data for the year 1895,1896,1915 and 1916 could not be obtained.
Lifecycle analysis streetcars for California State.
editThe S-curve parameters
| Variable | Value |
|---|---|
| K | 4738.09 |
| b | 0.14 |
| to | 1909.66 |
The projected track length (miles) as per the variable values is tabulated as:-
| Year | Track Length(Miles) | Projected Track Length (Miles) |
|---|---|---|
| 1894 | 992.67 | 477.71 |
| 1897 | 796.96 | 688.89 |
| 1898 | 806.33 | 774.77 |
| 1899 | 824.04 | 869.04 |
| 1900 | 845.37 | 971.94 |
| 1901 | 812.26 | 1083.58 |
| 1902 | 859.02 | 1203.90 |
| 1903 | 940.69 | 1332.66 |
| 1904 | 1218.48 | 1469.40 |
| 1905 | 1415.443 | 1613.45 |
| 1906 | 1522.17 | 1763.90 |
| 1907 | 1827.89 | 1919.67 |
| 1908 | 2230.11 | 2079.44 |
| 1909 | 2757.79 | 2241.79 |
| 1910 | 2870.58 | 2405.19 |
| 1911 | 2695.99 | 2568.05 |
| 1912 | 2986.45 | 2728.82 |
| 1913 | 3087.75 | 2886.04 |
| 1914 | 3245.35 | 3038.35 |
| 1917 | 3366.919 | 3455.20 |
| 1918 | 3406.357 | 3578.29 |
| 1919 | 3496.497 | 3692.76 |
| 1920 | 4057.727 | 3798.50 |
-
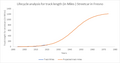
 Lifecycle Analysis for Track length (Miles) of Streetcar in California

The birthing phase is very small, the growth phase starts from 1899 and the period continued till 1914. The system started reaching the maturity from 1914 onwards.
Quantitative analysis for Urban Areas and streetcar system is
editIn the same way, the lifecycle analysis is carried out for the track length (Miles) of the streetcar for the urban places for which the streetcar system data is seen to be available consistently, also the streetcar system in those places have been analysed for which the system has sufficient data points, the results are presented as under:-
Fresno
editFresno urban area
editThe S-curve parameters
| Variable | Value |
|---|---|
| K | 1256.20 |
| b | 0.12 |
| to | 1943.94 |
The projected track length (miles) as per the variable values is tabulated as:-
| Year | Track Length(Miles) | Projected Track Length (Miles) |
|---|---|---|
| 1894 | 4.5 | 3.50 |
| 1897 | 4.5 | 4.98 |
| 1898 | 4.5 | 5.60 |
| 1899 | 4.5 | 6.30 |
| 1900 | 8.5 | 7.08 |
| 1901 | 8.5 | 7.96 |
| 1902 | 8.5 | 8.94 |
| 1903 | 14.5 | 10.05 |
| 1904 | 11.5 | 11.30 |
| 1905 | 15.5 | 12.69 |
| 1906 | 15.5 | 14.26 |
| 1907 | 15.5 | 16.02 |
| 1908 | 15.5 | 18.00 |
| 1909 | 15.5 | 20.21 |
| 1910 | 15.5 | 22.69 |
| 1911 | 31.6 | 25.47 |
| 1912 | 25.5 | 28.58 |
| 1913 | 31.31 | 32.06 |
| 1914 | 36.39 | 35.95 |
| 1917 | 64.01 | 50.57 |
| 1918 | 64.01 | 56.60 |
| 1919 | 64.01 | 63.32 |
| 1920 | 64.01 | 70.79 |
-
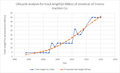
 Lifecycle analysis graph for Fresno (urban area) Streetcar for S-curve
_Streetcar_for_S-curve.png)
-
 Lifecycle analysis graph for Fresno (urban area) Streetcar extended period for S-curve
_Streetcar_extended_period_for_S-curve.png)
From the above figures, it is seen that the transport system in Fresno is birth phase is little long and the growth seems to start from 1910 comparison to its lifecycle considering the current form of system takes its own course without any intervention.
In Fresno 2 streetcar systems emerged, for the purpose of analysis the track length of all the companies forming one consolidation has been taken as a system from the initial years to 1920, there were 2 Streetcar system described as-
- Fresno Traction Company:- In Fresno the streetcar was operated through horses, operated by the Fresno Railroad Co., in 1900 new company Fresno, Belmont & Yosemite Railroad Co also started operation of horse-driven streetcar, in 1903 Fresno City Railway Co. was formed, it merged Fresno, Belmont & Yosemite Railroad Co in itself and started operating electric streetcars. In 1905 both Fresno Railroad Co & Fresno City Railway company consolidated to form Fresno Traction Company with electric streetcars.
- Fresno Interurban Railway Co.:- In 1913 San Joaquin Light & Power Corporation started is electric streetcars, this later became Fresno interurban Railway Co.
Fresno traction company
editThe S-curve parameters
| Variable | Value |
|---|---|
| K | 64.63 |
| b | 0.16 |
| to | 1914.21 |
The projected track length (miles) as per the variable values is tabulated as:-
| Year | Track Length(Miles) | Projected Track Length (Miles) |
|---|---|---|
| 1894 | 4.5 | 2.49 |
| 1897 | 4.5 | 3.92 |
| 1898 | 4.5 | 4.55 |
| 1899 | 4.5 | 5.27 |
| 1900 | 4.5 | 6.09 |
| 1901 | 4.5 | 7.03 |
| 1902 | 4.5 | 8.09 |
| 1903 | 15.5 | 9.29 |
| 1904 | 11.5 | 10.63 |
| 1905 | 15.5 | 12.12 |
| 1906 | 15.5 | 13.77 |
| 1907 | 15.5 | 15.57 |
| 1908 | 15.5 | 17.53 |
| 1909 | 15.5 | 19.64 |
| 1910 | 15.5 | 21.88 |
| 1911 | 31.6 | 24.24 |
| 1912 | 25.5 | 26.70 |
| 1913 | 25.5 | 29.22 |
| 1914 | 30.58 | 31.78 |
| 1917 | 45.01 | 39.39 |
| 1918 | 45.01 | 41.79 |
| 1919 | 45.01 | 44.08 |
| 1920 | 45.01 | 46.25 |
-
 Lifecycle analysis graph for Fresno traction company Streetcar system

From the chart the growth phase of Fresno Traction company is till 1899, the growth period is from 1899 onwards the system is to attain maturity in near future as the growth has slowed in the years from 1917.
For Fresno interurban
editAs there is only 2 points lifecycle analysis not carried out.
Los Angeles
editAnalysis of lifecycle of streetcar for the urban area and system is as under:-
For Los Angeles urban area.
edit| Variable | Value |
|---|---|
| K | 4885.29 |
| b | .14 |
| to | 1920.78 |
The projected track length (miles) as per the variable values is tabulated as:-
| Year | Track Length(Miles) | Projected Track Length (Miles) |
|---|---|---|
| 1894 | 117.99 | 108.53 |
| 1897 | 147.71 | 163.56 |
| 1898 | 153.87 | 187.30 |
| 1899 | 183.57 | 214.32 |
| 1900 | 199.57 | 245.03 |
| 1901 | 197.11 | 279.88 |
| 1902 | 197.86 | 319.33 |
| 1903 | 311.86 | 363.90 |
| 1904 | 389.62 | 414.12 |
| 1905 | 535.1 | 470.53 |
| 1906 | 509 | 533.68 |
| 1907 | 768.49 | 604.13 |
| 1908 | 1015.46 | 682.40 |
| 1909 | 1432.49 | 768.94 |
| 1910 | 1477.15 | 864.16 |
| 1911 | 1318.08 | 968.33 |
| 1912 | 1637.86 | 1081.61 |
| 1913 | 1658.56 | 1203.98 |
| 1914 | 1770.62 | 1335.22 |
| 1917 | 1450.02 | 1776.67 |
| 1918 | 1450.02 | 1936.72 |
| 1919 | 1481.54 | 2101.17 |
| 1920 | 1485.54 | 2268.52 |
-
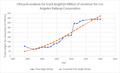
 Lifecycle analysis graph for Los Angeles urban area Streetcar

Here it is evident that the decline in the streetcar deployment started from 1914 onwards, but the S-curve projections show that if the external factors won’t have been there the growth, should have taken to further period.
For Los Angeles till 1920, 2 streetcar systems evolved after merging and consolidating.
- a. Los Angeles Railway Corporation.
- b. Pacific Electric Railway.
Los Angeles Railway Corporation (streetcar system) of Los Angeles
edit| Variable | Value |
|---|---|
| K | 573.60 |
| b | .13 |
| to | 1912.01 |
The projected track length (miles) as per the variable values is tabulated as:-
| Year | Track Length(Miles) | Projected Track Length (Miles) |
|---|---|---|
| 1894 | 104 | 50.65 |
| 1897 | 73.66 | 71.72 |
| 1898 | 76.12 | 80.25 |
| 1899 | 84.36 | 89.62 |
| 1900 | 94.36 | 99.86 |
| 1901 | 94.36 | 111.01 |
| 1902 | 94.36 | 123.07 |
| 1903 | 99.86 | 136.06 |
| 1904 | 127.62 | 149.97 |
| 1905 | 135 | 164.76 |
| 1906 | 152 | 180.39 |
| 1907 | 185.5 | 196.78 |
| 1908 | 212.93 | 213.86 |
| 1909 | 216.73 | 231.51 |
| 1910 | 221.6 | 249.61 |
| 1911 | 344.3 | 268.01 |
| 1912 | 344.3 | 286.56 |
| 1913 | 365 | 305.12 |
| 1914 | 376.25 | 323.53 |
| 1917 | 389.08 | 376.39 |
| 1918 | 389.08 | 392.81 |
| 1919 | 389.08 | 408.46 |
| 1920 | 389.08 | 423.27 |
-
 Lifecycle analysis graph for Los Angeles Railway Corporation Streetcar system

The system in initial years till 1899 was in birthing stage then till 1914 was in growth stage. The system started maturing 1914 onwards and there no growth as can be inferred by the deployment rate of track.
Pacific Electric Railway.
edit| Variable | Value |
|---|---|
| K | 2488.37 |
| b | .19 |
| to | 1915.44 |
The projected track length (miles) as per the variable values is tabulated as:-
| Year | Track Length(Miles) | Projected Track Length (Miles) |
|---|---|---|
| 1894 | 13.99 | 41.77 |
| 1897 | 74.05 | 72.89 |
| 1898 | 77.75 | 87.59 |
| 1899 | 99.21 | 105.13 |
| 1900 | 105.21 | 125.99 |
| 1901 | 102.75 | 150.74 |
| 1902 | 103.5 | 179.98 |
| 1903 | 212 | 214.36 |
| 1904 | 262 | 254.60 |
| 1905 | 400.1 | 301.38 |
| 1906 | 357 | 355.39 |
| 1907 | 582.99 | 417.23 |
| 1908 | 802.53 | 487.38 |
| 1909 | 1215.76 | 566.10 |
| 1910 | 1255.55 | 653.38 |
| 1911 | 973.78 | 748.87 |
| 1912 | 1293.56 | 851.84 |
| 1913 | 1293.56 | 961.15 |
| 1914 | 1394.37 | 1075.27 |
| 1917 | 1059.48 | 1427.20 |
| 1918 | 1059.48 | 1540.83 |
| 1919 | 1091 | 1649.44 |
| 1920 | 1095 | 1751.55 |
-
 Lifecycle analysis graph for Pacific Electric Railway Streetcar system

The system was in birthing phase till 1903, thereafter the growth phase continued till 1914 when the system declined and became stagnant in its maturity.
Sacramento
editFor Sacramento till 1920, 2 streetcar systems evolved after merging and consolidating.
- Pacific Gas & Electric Co. this company is the successor of the company operating since 1894.
- Sacramento Northern Railroad. This has started operating since 1919 and is interurban Rail. The same has not been considered for analysis.
Analysis of lifecycle of the streetcar for the urban area and system is for Sacramento will be same as there is only one system which has operated for the period. The track length of the interurban line have not been considered for analysis of urban area:-
Sacramento Urban area/ Pacific Gas & Electric Co
edit| Variable | Value |
|---|---|
| K | 50.63 |
| b | .10 |
| to | 1900.65 |
The projected track length (miles) as per the variable values is tabulated as:-
| Year | Track Length(Miles) | Projected Track Length (Miles) |
|---|---|---|
| 1894 | 18.5 | 17.05 |
| 1897 | 24.5 | 20.66 |
| 1898 | 24.5 | 21.92 |
| 1899 | 24.5 | 23.19 |
| 1900 | 24.5 | 24.48 |
| 1901 | 24.5 | 25.77 |
| 1902 | 24.5 | 27.06 |
| 1903 | 24.5 | 28.34 |
| 1904 | 24.5 | 29.60 |
| 1905 | 28 | 30.84 |
| 1906 | 38 | 32.06 |
| 1907 | 38 | 33.24 |
| 1908 | 28.9 | 34.38 |
| 1909 | 28.9 | 35.49 |
| 1910 | 34.14 | 36.55 |
| 1911 | 35.86 | 37.56 |
| 1912 | 39.6 | 38.52 |
| 1913 | 41.6 | 39.44 |
| 1914 | 42.59 | 40.30 |
| 1917 | 43.89 | 42.59 |
| 1918 | 43.89 | 43.26 |
| 1919 | 43.91 | 43.88 |
| 1920 | 43.91 | 44.45 |
-
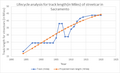 Lifecycle analysis graph for Sacramento (urban area) streetcar
_streetcar.png)
The Street car system of Sacramento in 1894 was already in growth phase and it was shifting to its maturity from 1906 the same can be seenfrom the S-curve that has started declining in the deployment.
San Diego
editSan Diego urban Area
edit| Variable | Value |
|---|---|
| K | 378.27 |
| b | .15 |
| to | 1917.45 |
The projected track length (miles) as per the variable values is tabulated as:-
| Year | Track Length(Miles) | Projected Track Length (Miles) |
|---|---|---|
| 1894 | 40.5 | 9.88 |
| 1897 | 39 | 15.46 |
| 1898 | 22 | 17.91 |
| 1899 | 32 | 20.74 |
| 1900 | 32 | 23.98 |
| 1901 | 18 | 27.68 |
| 1902 | 18 | 31.91 |
| 1903 | 18 | 36.72 |
| 1904 | 18 | 42.16 |
| 1905 | 17 | 48.30 |
| 1906 | 22.7 | 55.18 |
| 1907 | 27.9 | 62.86 |
| 1908 | 65 | 71.37 |
| 1909 | 87.6 | 80.74 |
| 1910 | 92.93 | 90.97 |
| 1911 | 101.12 | 102.05 |
| 1912 | 143.86 | 113.95 |
| 1913 | 163.46 | 126.60 |
| 1914 | 164.38 | 139.91 |
| 1917 | 189.52 | 182.53 |
| 1918 | 194.337 | 197.11 |
| 1919 | 227.727 | 211.60 |
| 1920 | 305.697 | 225.83 |
-
 Lifecycle analysis graph for San Diego (urban area) Streetcar
_Streetcar.png)
The street car system in San Diego had a birthing phase till 1906 and the growth period started from1906 onwards , the system is in its growth phase by the 1920 data and the system may further grow.
For Sandiego till 1920, 5 streetcar systems were functioning but only 1 system has been considered for analysis. The details of the system along with consideration for analysis are as under:-
- Bay Shore R. R. Co -not analysed as there is no change in track length deployed.
- Los Angeles & San Diego Beach Railway- not analysed as only there is no change in track length deployed.
- Point Loma Railroad Co.- not analysed as only 2 data points available.
- San Diego Electric Railway Co- analysed.
- San Diego & Arizona Ry. Co.- analysed.
San Diego Electric Railway Co.
edit| Variable | Value |
|---|---|
| K | 95.36 |
| b | .17 |
| to | 1910.10 |
The projected track length (miles) as per the variable values is tabulated as:-
| Year | Track Length(Miles) | Projected Track Length (Miles) |
|---|---|---|
| 1894 | 20 | 5.91 |
| 1897 | 20 | 9.42 |
| 1898 | 3 | 10.95 |
| 1899 | 18 | 12.70 |
| 1900 | 18 | 14.67 |
| 1901 | 18 | 16.89 |
| 1902 | 18 | 19.37 |
| 1903 | 18 | 22.10 |
| 1904 | 18 | 25.10 |
| 1905 | 17 | 28.34 |
| 1906 | 20.7 | 31.82 |
| 1907 | 25.4 | 35.49 |
| 1908 | 34.5 | 39.33 |
| 1909 | 35.6 | 43.28 |
| 1910 | 44.55 | 47.29 |
| 1911 | 44.55 | 51.31 |
| 1912 | 60.47 | 55.27 |
| 1913 | 62.06 | 59.14 |
| 1914 | 63.5 | 62.84 |
| 1917 | 82.47 | 72.69 |
| 1918 | 84.65 | 75.48 |
| 1919 | 75.75 | 78.01 |
| 1920 | 82.42 | 80.28 |
-
 Lifecycle analysis graph for San Diego Electric Railway Co. Streetcar

The growth phase started from 1900, the growth phase lasted till 1914 and thereafter entered in its maturity phase as the decline started.
San Diego & Arizona Ry. Co
edit| Variable | Value |
|---|---|
| K | 250.00 assumed as for a fit, however the point don’t converge and there is no S curve feasible for the data |
| b | .17 |
| to | 1918.88 |
The projected track length (miles) as per the variable values is tabulated as:-
| Year | Track Length(Miles) | Projected Track Length (Miles) |
|---|---|---|
| 1908 | 27 | 35.93 |
| 1909 | 48.5 | 40.64 |
| 1910 | 48.5 | 45.90 |
| 1911 | 48.26 | 51.73 |
| 1912 | 75.08 | 58.18 |
| 1913 | 75.09 | 65.29 |
| 1914 | 75.09 | 73.08 |
| 1917 | 75.11 | 100.69 |
| 1918 | 75.11 | 111.30 |
| 1919 | 117.4 | 122.57 |
| 1920 | 188.7 | 134.45 |
-
 Lifecycle analysis graph for San Diego & Arizona Ry Co. Streetcar system

Here the data is not converging and not giving the S-curve. There seems to be small phases of linear growth and then stagnation for longer periods. It seems to be the system is in growth phase with slow rate of growth.
San Francisco
edit| Variable | Value |
|---|---|
| K | 633 assumed as for a fit, however the point don’t converge and there is no S curve feasible for the data |
| b | .11 |
| to | 1901.19 |
The projected track length (miles) as per the variable values is tabulated as:-
| Year | Track Length(Miles) | Projected Track Length (Miles) |
|---|---|---|
| 1894 | 237 | 197.44 |
| 1897 | 270.84 | 244.83 |
| 1898 | 270.84 | 261.55 |
| 1899 | 259.22 | 278.59 |
| 1900 | 261.8 | 295.86 |
| 1901 | 271.7 | 313.26 |
| 1902 | 266.09 | 330.67 |
| 1903 | 274.23 | 348.00 |
| 1904 | 436.6 | 365.14 |
| 1905 | 422.66 | 381.99 |
| 1906 | 422.66 | 398.46 |
| 1907 | 420.79 | 414.47 |
| 1908 | 466.29 | 429.94 |
| 1909 | 485.49 | 444.82 |
| 1910 | 467.36 | 459.05 |
| 1911 | 379.86 | 472.59 |
| 1912 | 368.66 | 485.41 |
| 1913 | 372.39 | 497.50 |
| 1914 | 378.82 | 508.86 |
| 1917 | 581.06 | 538.57 |
| 1918 | 618.75 | 547.08 |
| 1919 | 623.31 | 554.93 |
| 1920 | 632.61 | 562.16 |
-
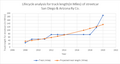
 Lifecycle analysis graph for San Francisco (urban area) Streetcar
_Streetcar.png)
Here in San Francisco the S-curve was not achieved in the period 1894-1920, as the trend shows the system was already in maturity phase. This can further be seen that the systems comprising the streetcar network of San Francisco were already stagnant or were in maturity as under:-
| United Railroads of San Francisco | ||||||
|---|---|---|---|---|---|---|
| Year | 1897 | 1990 | 1904 | 1914 | 1917 | 1920 |
| Track length(miles) | 239.84 | 230.8 | 258.41 | 271.58 | 286.66 | 272.77 |
| Municipal Railway (consolidation of Presidio & Ferries Railroad Co & Geary Street Park & Ocean Railroad Co.) | ||||||
|---|---|---|---|---|---|---|
| Year | 1897 | 1990 | 1904 | 1914 | 1917 | 1920 |
| Track length(miles) | 19.5 | 19.5 | 19.17 | 15.67 | - | 67.33 |
| California Street Cable Railroad Co | ||||||
|---|---|---|---|---|---|---|
| Year | 1897 | 1990 | 1904 | 1914 | 1917 | 1920 |
| Track length(miles) | 11.5 | 11.5 | 11.5 | 11.5 | 11.5 | 11.5 |
The other systems which were added later:-
| North western Pacific Railroad Co | ||
|---|---|---|
| Year | 1909 | 1920 |
| Track length(miles) | 127.37 | 54.5 |
| Central California Trac. Co | ||
|---|---|---|
| Year | 1917 | 1920 |
| Track length(miles) | 70.8 | 70.8 |
| Ocean Shore R. R. Co. | |||
|---|---|---|---|
| Year | 1908 | 1909 | 1920 |
| Track length(miles) | 36 | 53 | 54.4 |
The increase in the track mile length overall is attributed to few new streetcar system starting their operation and not expanding.
San Jose
edit| Variable | Value |
|---|---|
| K | 144 assumed as for a fit, however the point don’t converge and there is no S curve feasible for the data |
| b | .12 |
| to | 1908.1 |
The projected track length (miles) as per the variable values is tabulated as:-
| Year | Track Length(Miles) | Projected Track Length (Miles) |
|---|---|---|
| 1894 | 24.5 | 23.62 |
| 1897 | 31.5 | 30.10 |
| 1898 | 39.5 | 32.63 |
| 1899 | 39.5 | 35.37 |
| 1900 | 39 | 38.34 |
| 1901 | 31 | 41.56 |
| 1902 | 36 | 45.05 |
| 1903 | 36 | 48.82 |
| 1904 | 54 | 52.91 |
| 1905 | 66 | 57.34 |
| 1906 | 69 | 62.13 |
| 1907 | 78.5 | 67.32 |
| 1908 | 68.5 | 72.93 |
| 1909 | 80.5 | 79.01 |
| 1910 | 90.5 | 85.58 |
| 1911 | 90.5 | 92.69 |
| 1912 | 122.06 | 100.38 |
| 1913 | 122.06 | 108.69 |
| 1914 | 138.91 | 117.67 |
| 1917 | 123.08 | 149.19 |
| 1918 | 143.69 | 161.40 |
| 1919 | 136.25 | 174.59 |
| 1920 | 141.5 | 188.81 |
-
 Lifecycle analysis graph for San Jose (urban area) Streetcar
_Streetcar.png)
The data for deployment of Streetcar in sanjose is not converging to give the S-curve, for the assumed value of track miles just higher than track miles in year 1920. Further from the track length curve it is seen that the the system is growing since 1894, after 1914 the system has started declining or became almost sagnant, this may be due to the externalities.
Stockton
edit| Variable | Value |
|---|---|
| K | 146.98 |
| b | .15 |
| to | 1915.53 |
The projected track length (miles) as per the variable values is tabulated as:-
| Year | Track Length(Miles) | Projected Track Length (Miles) |
|---|---|---|
| 1894 | 12 | 5.11 |
| 1897 | 12 | 7.96 |
| 1898 | 12 | 9.20 |
| 1899 | 12 | 10.63 |
| 1900 | 12 | 12.26 |
| 1901 | 12 | 14.11 |
| 1902 | 12 | 16.20 |
| 1903 | 12 | 18.56 |
| 1904 | 12 | 21.21 |
| 1905 | 12 | 24.17 |
| 1906 | 12 | 27.45 |
| 1907 | 12 | 31.07 |
| 1908 | 41 | 35.02 |
| 1909 | 41 | 39.30 |
| 1910 | 41 | 43.90 |
| 1911 | 82 | 48.79 |
| 1912 | 83.3 | 53.95 |
| 1913 | 83.3 | 59.32 |
| 1914 | 92.98 | 64.85 |
| 1917 | 75.71 | 81.79 |
| 1918 | 75.71 | 87.33 |
| 1919 | 90.51 | 92.71 |
| 1920 | 95.81 | 97.88 |
-
 Lifecycle analysis graph for Stockton (urban area) Streetcar
_Streetcar.png)
In Stockton the S-curve for track length deployment shows that the birthing phase is till 1900. The phase from 1900-1914 marks to be growth period and the maturity phase starts from 1914 onwards.
Conclusion
editThe deployment of Streetcars in California was attributed to the demand due to the influx and settlement of people in the places as a result of Goldrush, for providing better and faster transportation modes. The improved linkages to the larger urban area further extended the reaches of the towns.
The initial deployment of horse-driven street cars gradually transformed to cable-driven and then to electric driven streetcars as a result of technological developments.
The streetcar deployment rate in major places started declining from 1914, this could be attributed to the California Alien Land Law of 1913[7] which led to discrimination in citizenship to Asian communities, limiting the number of passengers and trips. World War-I in 1917 further affected the streetcar operation.
Another factor which led to the maturity of the streetcar systems was the availability of better and efficient transport through the automobile. If these factors won't have come into effect then the maturity period will be delayed for the deployment of Streetcar systems, though the S-curve for streetcars for California as a state is a fitting curve the maturity phase is attributed to saturation of deployment of streetcars and oversupply due to exodus of the communities discriminated of citizenship in areas of California.
References
edit- ↑ "Early California History: An Overview"
- ↑ [History.com Editors, Transcontinental Railroad retrieved from https://www.history.com/topics/inventions/transcontinental-railroad]
- ↑ [Street Railways Enable City Growth retrieved from https://www.railswest.com/history/citystreetrailways.html]
- ↑ [Garrison, William L., and David M. Levinson. The Transportation Experience. New York: Oxford UP, 2014. Print.]
- ↑ [Garrison, William L., and David M. Levinson. The Transportation Experience. New York: Oxford UP, 2014. Print.]
- ↑ [American Street railway investments, a supplement to Street Railway Journal, edition, 1894, 1897,1898,1899,1990,1901,1902,1903,1904,1905,1906,1907,1908,1909,1910,1911,1912,1913,1914,1917,1918,1919 and 1920]
- ↑ [Cherstin M. Lyon, California State University, San, Bernardino, Alien land laws retrieved from https://encyclopedia.densho.org/Alien_land_laws/]