Data Science: An Introduction/Thinking Like a Mathematician

Note to Contributors (remove this section when the chapter is complete)
editFirst, please register yourself with Wikibooks (and list yourself below), so that we know who our co-contributors are. Also, please abide by the Wikibooks Editing Guidelines, Manual of Style, and Policies and Guidelines. Thank you.
Secondly, we only need basic, clear, straightforward information in each chapter. We are not trying to be exhaustive or complete—the value of this book is in the simple synthesis across subjects. There are other venues in which to wax eloquent on the deepness and complexities of a particular subject. Please place yourself in a "beginner's mind" as you make contributions. Please also scope each chapter so that it can be taught in a one-hour class period. If the chapter requires more than an hour to teach, it is probably too detailed.
- To the extent possible, please use terms and concepts in the way in which they are defined in the Wikipedia and Wiktionary. This way students can refer to the corresponding Wikipedia / Wiktionary page to get a deeper understanding of the concept.
Thirdly, this is a cross-disciplinary book. We want to help people apply data science to all fields. Therefore, we need a wide variety of simple examples and simple exercises.
Fourthly, please adhere to the simple structure of each chapter: Summary of Main Points, Discussion, More Reading, Exercises, and References. We want the More Reading section to link to on-line resources. The References section may contain off-line resources. To start a new page, you should use the wiki markup from this prototype page.
Fifthly, as with any Wikibook please feel free to make corrections, expand explanations, and make additions where necessary, even if it is not "your" chapter. Use the discussion page to explain changes that might be controversial.
Sixthly, some syntax rules:
- Please bold key terms and phrases the student should learn.
- Put the name of functions and code snippets using the 'code' tags:
<code>lm()</code> - Use in-line links
[[ ]]to the Wikipedia, Wiktionary, WikiCommons, Wikibooks, and other Wikimedia Foundation properties. - Use references (<ref> </ref>) to "external" sources—both on-line and off-line.
- Use the citations templates to make citations : Template:Cite book, Template:Cite web, Template:Cite journal
- If you want to add an image or graph, you should load it into the Commons rather than uploading into Wikibooks.
- If appropriate, add the tag
{{Created with R}}) when you upload the graph.
- If appropriate, add the tag
- If using a different package than R standard packages, put the name of the package in bold in parenthesis after each function : <code>MCMCprobit()</code> ('''MCMCpack''')
- You can use the third chapter Definitions of Data as an example of how to craft a chapter.
Finally, thank you so much for volunteering to be part of our our team!
Chapter Summary
editWhen a data scientist thinks like a mathematician, they think in terms of measurement and models. The tasks are to decompose the problem into it basic components; represent those components numerically; and combine the components together into an accurate expression of the problem and its solution.
Discussion
editAccording to the Wikipedia, mathematics is the study of quantity, structure, space, and change. When these are used to solve practical problems it called applied mathematics. In addition to these main concerns, there are also topics dedicated to exploring links from the heart of mathematics to other fields: to logic, to set theory, and more recently to the study of uncertainty. For the purposes of the is book, we will not explore these last three aspects of mathematics.
Quantity
editThe study of quantity starts with numbers, first the familiar natural numbers and integers ("whole numbers") and the basic arithmetical operations on them, which are characterized in arithmetic. As the number system is further developed, the integers are recognized as a subset of the rational numbers ("fractions"). These, in turn, are contained within the real numbers, which are used to represent continuous quantities. Real numbers are generalized to complex numbers.
Natural numbers Integers Rational numbers Real numbers Complex numbers


When thinking like a mathematician, a data scientist needs to ask the questions, "how will the thing I am interested in be represented by numbers?" and "what kind of numbers will best represent the thing I am interested in?"
Structure
editMany sets of mathematical objects exhibit internal structure. Mathematics exposes these structures by applying rules (axioms and operations) to the objects. Algebra is a powerful tool to understand mathematical structures. It combines the concept of variables with arithmetic to solve equations. Algebra is applied to many different, and seemingly, unrelated problems. Some of these problems include rings, groups, graphs, and fields.


Sets Rings Groups Graphs Fields


When thinking like a mathematician, a data scientist needs to ask the questions, "what sort of internal structure does the thing I am interested in have?" and "what set of equations will expose the structure?"
Space
editThe study of space' originates with geometry, in particular, Euclidean geometry. Trigonometry is the branch of mathematics that deals with relationships between the sides and the angles of triangles; it combines space and numbers, and encompasses the well-known Pythagorean theorem. The advanced study of space includes include higher-dimensional geometry, non-Euclidean geometries, Differential Geometry, Topology, Fractal geometry, and Wikipedia:Measure theory. For the purposes of this book, we will not cover these more advanced geometries.


Geometry Trigonometry Differential geometry Topology Fractal geometry Measure theory


When thinking like a mathematician, a data scientist needs to ask the questions, "does the thing I am interested have a spatial component, either actual or theoretical?" and "how do I capture and represent that spatial component?"
Change
editUnderstanding and describing change is a common theme in science, and calculus was developed as a powerful tool to investigate it. Functions are a central concept describing a changing quantity. Many problems lead naturally to relationships between a quantity and its rate of change. That is, for a non-straight line, the slope is different at every point on the line. Understanding these changing slopes are studied in Differential calculus. Finding the areas under a curves is called Integral calculus. Calculus is beyond the scope of this book.

Tangent line at (x, f(x)). The derivative f′(x) of a curve at a point is the slope (rise over run) of the line tangent to that curve at that point. 
Integration can be thought of as measuring the area S under a curve, defined by f(x), between two points (here a and b).


Thinking as a mathematician, the data scientist must ask, "does the relationship between the things I am interested change (over time or over distance)?" and "how will I describe the changing relationship?"
Applied Math
editApplied mathematics concerns itself with mathematical methods that are typically used in science, engineering, business, and industry. Thus, "applied mathematics" is math with specialized knowledge. Generally speaking, this is the kind of math that Data Scientists practice.
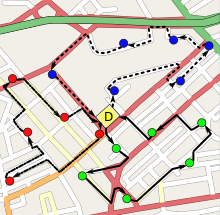
Efficient solutions to the vehicle routing problem require tools from mathematics. 
Modelling financial markets is done with mathematics.


Assignment/Exercise
editThis Project #2, which spans four chapters. Assemble into groups of 3 or 4 students. A group of three may not have the same members as the group for Project #1. A group of four may have no more than two students repeating from the group from the Project #1. This group will do the entire project together.
- Replicate Galileo's "inclined plane" experiment. Start by designing the research and write down your plan. List materials needed, specify methods to be used, identify variables to be measured, create data recording sheets, etc.
- Conduct the experiment according to the design. Take pictures. Record your data results.
- Enter the data into R. Use R to produce tables and draw plots of your data. See if you can draw the theoretical curve Galileo was trying to discover on your data plots.
- Prepare a slide presentation that includes a description of your methods, pictures of your apparatus, a table of your raw data, a table of your analyzed results, plots of your results, a list of several things the group learned on its own about data science during the course of this project.
Note: Your group can specialize on tasks, but everyone needs to participate in all phases of the assignment. Also, the chapters covered to this point do not teach you everything you need to know to do this assignment. Please do the best you can with what you know. This assignment is not just to show the instructor how much of the previous chapters you have learned, but the assignment is a learning experience in and of itself. The assignment is designed for the students to discover knowledge not contained in the chapters.
More Reading
editReferences
editCopyright Notice
edit
You are free:
- to Share — to copy, distribute, display, and perform the work (pages from this wiki)
- to Remix — to adapt or make derivative works
Under the following conditions:
- Attribution — You must attribute this work to Wikibooks. You may not suggest that Wikibooks, in any way, endorses you or your use of this work.
- Share Alike — If you alter, transform, or build upon this work, you may distribute the resulting work only under the same or similar license to this one.
- Waiver — Any of the above conditions can be waived if you get permission from the copyright holder.
- Public Domain — Where the work or any of its elements is in the public domain under applicable law, that status is in no way affected by the license.
- Other Rights — In no way are any of the following rights affected by the license:
- Your fair dealing or fair use rights, or other applicable copyright exceptions and limitations;
- The author's moral rights;
- Rights other persons may have either in the work itself or in how the work is used, such as publicity or privacy rights.
- Notice — For any reuse or distribution, you must make clear to others the license terms of this work.The best way to do this is with a link to the following web page.