Chemical Sciences: A Manual for CSIR-UGC National Eligibility Test for Lectureship and JRF/Physical Characterisation of Organic Compounds
This Section is very important from an exam point of view. Therefore, it is required to expend it. If you have previous year questions, please add them with model solutions to these questions.
There are several spectroscopic techniques which can be used to identify organic molecules: infrared (IR), mass spectroscopy (MS) UV/visible spectroscopy (UV/Vis) and nuclear magnetic resonance (NMR).
IR, NMR and UV/vis spectroscopy are based on observing the frequencies of electromagnetic radiation absorbed and emitted by molecules. MS is based on measuring the mass of the molecule and any fragments of the molecule which may be produced in the MS instrument.
UV/Visible Spectroscopy edit
UV/Vis Spectroscopy uses ultraviolet and/or visible light to examine the electronic properties of molecules. Irradiating a molecule with UV or Visible light of a specific wavelength can cause the electrons in a molecule to transition to an excited state. This technique is most useful for analyzing molecules with conjugated systems or carbonyl bonds.
NMR Spectroscopy edit
Nuclear Magnetic Resonance (NMR) Spectroscopy is one of the most useful analytical techniques for determining the structure of an organic compound. There are two main types of NMR, 1H-NMR (Proton NMR) and 13C-NMR (Carbon NMR). NMR is based on the fact that the nuclei of atoms have a quantized property called spin. When a magnetic field is applied to a 1H or 13C nucleus, the nucleus can align either with (spin +1/2) or against (spin -1/2) the applied magnetic field.
These two states have different potential energies and the energy difference depends on the strength of the magnetic field. The strength of the magnetic field about a nucleus, however, depends on the chemical environment around the nucleus. For example, the negatively charged electrons around and near the nucleus can shield the nucleus from the magnetic field, lowering the strength of the effective magnetic field felt by the nucleus. This, in turn, will lower the energy needed to transition between the +1/2 and -1/2 states. Therefore, the transition energy will be lower for nuclei attached to electron donating groups (such as alkyl groups) and higher for nuclei attached to electron withdrawing groups (such as a hydroxyl group).
In an NMR machine, the compound being analyzed is placed in a strong magnetic field and irradiated with radio waves to cause all the 1H and 13C nuclei to occupy the higher energy -1/2 state. As the nuclei relax back to the +1/2 state, they release radio waves corresponding to the energy of the difference between the two spin states. The radio waves are recorded and analyzed by computer to give an intensity versus frequency plot of the sample. This information can then be used to determine the structure of the compound.
Aromatics in H-NMR
Electron Donating Groups vs. Electron Withdrawing Groups
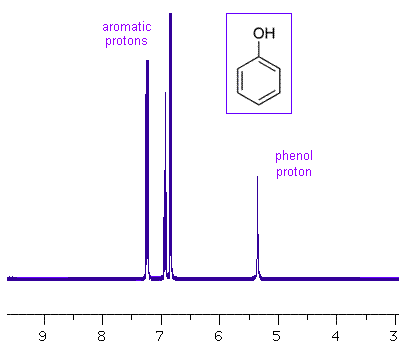
On monosubstituted rings, electron donating groups resonate at high chemical shifts. Electron donating groups increase the electron density by releasing electrons into a reaction center, thus stabilizing the carbocation. An example of an electron donating group is methyl (-CH3).
Accordingly, electron withdrawing groups are represented at low chemical shifts. Electron withdrawing groups pull electrons away from a reacting center. This can stabilize an electron rich carbanion. Some examples of electron withdrawing groups are halogens (-Cl, -F) and carboxylic acid (-COOH).
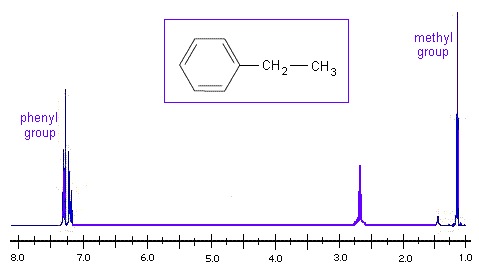
Looking at the H NMR spectrum of ethyl benzene, we see that the methyl group is the most electron withdrawing, so it appears at the lowest chemical shift. The aromatic phenyl group is the most electron donating, so it has the highest chemical shift.
Disubstituted Rings
The sum of integrated intensity values for the entire aromatic region shows how many substituents are attached to the ring, so a total value of 4 indicates that the ring has 2 substituents. When a benzene ring has two substituent groups, each exerts an influence on following substitution reactions. The site at which a new substituent is introduced depends on the orientation of the existing groups and their individual directing effects. For a disubstituted benzene ring, there are three possible NMR patterns.
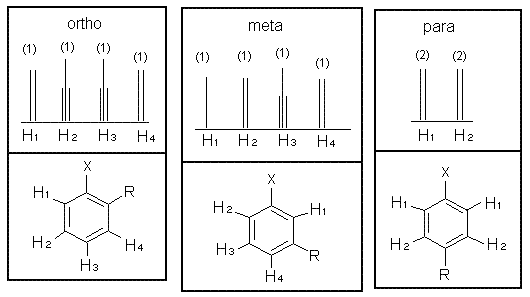
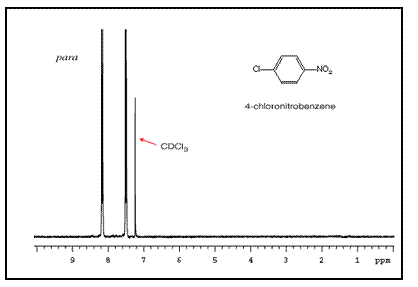
Note that para-substituted rings usually show two symmetric sets of peaks that look like doublets.
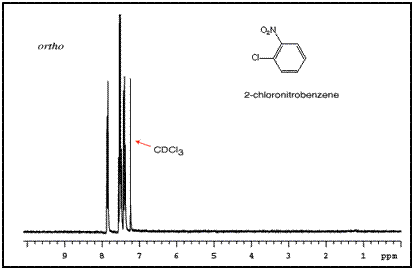
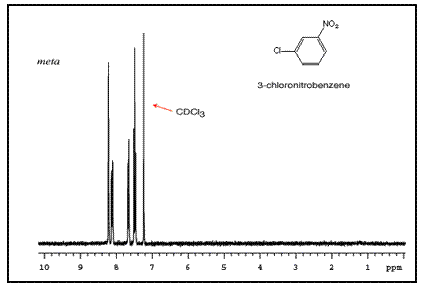
The order of these peaks is dependent on the nature of the two substituents. For example, the three NMR spectra of chloronitrobenzene isomers are below:
Mass Spectroscopy edit
A mass spectroscope measures the exact mass of ions, relative to the charge. Many times, some form of separation is done beforehand, enabling a spectrum to be collected on a relatively pure sample. An organic sample can be introduced into a mass spectroscope and ionised. This also breaks some molecules into smaller fragments.
The resulting mass spectrum shows:
1) The heaviest ion is simply the ionised molecule itself. We can simply record its mass.
2) Other ions are fragments of the molecule and give information about its structure. Common fragments are:
| species | formula | mass |
| methyl | CH3+ | 15 |
| ethyl | C2H5+ | 29 |
| phenyl | C6H5+ | 77 |
Infrared spectroscopy. edit
Absorbing infrared radiation makes covalent bonds vibrate. Different types of bond absorb different wavelengths of infrared:
Instead of wavelength, infrared spectroscopists record the wavenumber; the number of waves that fit into 1 cm. (This is easily converted to the energy of the wave.)
For some reason the spectra are recorded backwards (from 4000 to 500 cm-1 is typical), often with a different scale below 1000 cm-1 (to see the fingerprint region more clearly) and upside-down (% radiation transmitted is recorded instead of the absorbance of radiation).
The wavenumbers of the absorbed IR radiation are characteristic of many bonds, so IR spectroscopy can determine which functional groups are contained in the sample. For example, the carbonyl (C=O) bond will absorb at 1650-1760cm-1.
Summary of absorptions of bonds in organic molecules edit
Infrared Spectroscopy Correlation Table
| Bond | Minimum wavenumber (cm-1) | Maximum wavenumber (cm-1) | Functional group (and other notes) |
| C-O | 1000 | 1300 | Alcohols and esters |
| N-H | 1580 | 1650 | Amine or amide |
| C=C | 1610 | 1680 | Alkenes |
| C=O | 1650 | 1760 | Aldehydes, ketones, acids, esters, amides |
| O-H | 2500 | 3300 | Carboxylic acids (very broad band) |
| C-H | 2850 | 3000 | Alkane |
| C-H | 3050 | 3150 | Alkene (Compare intensity to alkane for rough idea of relative number of H atoms involved.) |
| O-H | 3230 | 3550 | H-bonded in alcohols |
| N-H | 3300 | 3500 | Amine or amide |
| O-H | 3580 | 3670 | Free –OH in alcohols (only in samples diluted with non-polar solvent) |
Absorptions listed in cm-1.
Typical method edit
A beam of infra-red light is produced and split into two separate beams. One is passed through the sample, the other passed through a reference which is often the substance the sample is dissolved in. The beams are both reflected back towards a detector, however first they pass through a splitter which quickly alternates which of the two beams enters the detector. The two signals are then compared and a printout is obtained.
A reference is used for two reasons:
- This prevents fluctuations in the output of the source affecting the data
- This allows the effects of the solvent to be cancelled out (the reference is usually a pure form of the solvent the sample is in).
References & notes edit
SDBS is a free online database of Spectral analysis including many IR, NMR and MS graphs.
