Strategy for Information Markets/Network Externalities/Two-Sided Platforms
At their simplest, network externalities come from something like a telephone, where every person on the network wants to connect to other people on the network in a more-or-less symmetric fashion. Another form of network externalities arises when a network connects two different kinds of users. A computer operating system may not do much on its own, but it allows users to run the software they want to use. From the other side, the operating system allows software developers to reach their customers. This is a two-sided platform. Such a platform has network externalities because the users of the platform benefit when more software developers write for the platform and software developers benefit when there are more users available to sell their software to.
Examples edit
There are many different examples of industries and markets that have two-sided networks. Some of the major markets that have two-sided networks are payment systems, media resources, the software market, and other markets for information goods where there is not physical product.
Payment System edit
Credit cards are payment systems that allow the customer (side 1 of the network) to make purchases at a merchant (side 2 of the network). In this network both sides receive positive externalities from being a member of the network. The credit card holder benefits by there being a merchant that accepts the credit card. The more merchants that do so, the more the user benefits. Other the other side, the merchant benefits because the credit card allows the user to make purchases through the merchant. The more customers who use the card, the more opportunity the merchant has to make a sale.
Media Resources edit
Television and newspapers are example of markets that operate on the idea that there are at least two sides of the market. The market for the media industry can include the consumer, media outlet, and advertiser. When looking at the media industry it is important to think about how the different sides of the market relate and benefit from each other. For example, a consumer is looking to benefit from the market by gaining entertainment and or information from the media outlets. The more media providers there are in the industry the more information the consumer gains through positive network externalities. The media provider also gains from a large number of consumers because the demand for the information increases as there are more consumers in the network. This market becomes slightly more complex if you factor in a third side of the market, the advertiser. When a media outlet relies on an advertiser it gains positive externalities from more advertisers because the more advertisers the more potential support/ money the media outlet can gain. Advertisers benefit from more consumers and media outlets because their “information” is available to more people. However, not all media outlets rely on advertisers to support the market. If the media outlet relies on an advertiser the relationship between the consumer and the media outlet changes slightly. This is because while the consumer benefits from more media produces they do not necessary benefit from more advertisers. Some argue that the consumer does benefit from more advertisers because they are exposed to more “information” weather it is relevant to their primary information goal or not.
Software edit
The software market is often used as how how markets can be two-sided. This may be because the market is heavily technology driven and the market includes industries like video games, operating systems, and internet browsers. Because two-sided platforms require a "platform" for the different sides of the network to connect around software is often on one of the sides of the network. An example of this is an operating system acting as a platform which connects software developers to software users. This is a mutualy benifical relationship that is built around a platform. A good example of competing networks related to the software industry is the browser wars. This software technology provides a perfect platform to bring the two sides of the market together. With the example of a video game system you can see how the two sides have network effects caused by the other side of the network. If there are game/software developers then users will benefit. If there are more users then the developers will benefit vies versa.
Shopping Malls edit
Two-sided platforms can also be physical spaces. A shopping mall connects shoppers with retailers. Retailers benefit from having a busy mall, while shoppers benefit from having multiple retailers easily accessible.
Multi-sided platforms edit
While the expression two-sided helps for discussion, and our analysis below will be mostly limited to platforms with two sides, there are certainly platforms which connect more than two kinds of users. Modern console game systems such as Sony's PlayStation connect users with game developers, but also internet providers and movie studios. An operating system such as Microsoft's Windows connects software users, software developers, and hardware manufacturers.[1]
Advertising-supported media edit
Free television and radio broadcasts are typically supported by advertising. Many magazines and newspapers charge for purchase but also receive substantial revenue from advertisers. Online media outlets are also frequently supported by advertising, either as their exclusive source of revenue, or combined with subscription fees.
We can almost describe an advertising-supported medium as being a two-sided platform, but have to keep in mind it doesn't always fit. In fact, it depends on specifics of the medium and how the consumer views the advertising. If a typical reader of a fashion magazine sees the advertisements therein as one of the features which makes the magazine appealing, then that magazine can truly be seen as a two-sided platform: The reader benefits from the advertising, and the advertisers benefit from the readers. If the readers of a newspaper value the classified advertisements in and of themselves, the newspaper can be considered a two-sided platform. On the other hand, if viewers of network television programs don't enjoy the advertising, but are willing to sit through the ads to see the programs, then those programs should not be considered two-sided platforms. Advertisers benefit from more viewers, but it doesn't work the other way.
Still, we can use similar analysis to two-sided platforms to analyze advertising platforms whether the viewers consider the advertising a benefit or a drawback to using the medium.
One thing to note about this kind of breakdown is that it is the aggregate which matters. It does not make sense to say that a product is a two-sided platform for one user who enjoys the advertising and not a two-sided platform for another user who dislikes the advertising. What matters is whether consumers in aggregate respond positively to the advertising by being more willing to buy (or just use) the product.
| “ | If you are not paying for it, you're not the customer; you're the product being sold.[2] | ” |
Graphing the demand structure edit
Given that demand is 2-sided, the graphs will necessarily be more complicated. However, it's still worthwhile to have graphical tools to analyze these markets. We're going to take a similar approach to one-sided network externalities and figure out how to graph demand.
Influence of expected quantity edit
- Figure
-
 Figure 1(a) Actual quantity demanded by readers (QA) at $50 given expected quantity of authors (QBx)
 -
 Figure 1(b) Actual quantity demanded by authors (QB) at $50 given expected quantity of readers (QAx)


With single-sided network externalities, consumers were concerned about how many other people would be a part of their network, so we started by graphing the quantity demanded as a function of the expected quantity. With two-sided platforms, people are concerned with how many users are on the other side of the market, so that's what we want to graph. Let's use the concrete example of an e-book device. The device is a platform which connects readers to authors. The more authors there are (or are expected to be) the more readers will be interested in using the device. The more readers are expected, the more authors will be interested in writing for the device. We'll label these two sides (A) for the readers and (B) for the authors.
As with the single-sided case, we'll initially ceteris paribus ignore price by setting the prices on both sides (pA and pB) to some fixed level. We'll need two graphs, however, one for each side of the market. Figure 1(a) shows demand for side (A) given the expectations of side (B). The expected number of authors (QBx) is on the horizontal axis and the actual quantity demanded by readers (QA) is on the vertical axis. QA is given as a function of QBx and pA, but the prices are being held constant.
Unlike the single-sided case, we can't stop with Figure 1(a), but also need Figure 1(b). Figure 1(b) is the same idea, but from the authors' side. The quantity they demand (QB) depends on the expected number of readers (QAx) in much the same way. However, "much the same way" does not mean exactly the same! For instance, a reader trying to decide whether an e-book device is a worthwhile platform may well be satisfied to know that there are 10,000 authors writing for the device. An author trying to decide whether to write for the same device is unlikely to be satisfied knowing there are only 10,000 readers (only a small fraction of which will be interested in any particular book). The graphs shown here are intended to be general and easy-to-read, but the particular scales, curvature, intercept points, and so forth are likely to be very different from product to product and on the two sides of the platform.
Demand equilibrium edit
 |
| Figure 2: Equilibrium quantity demanded on each side at fixed prices. |
We see two complete curves of possible quantities at the given prices. However, just as in the one-sided case, not all of those quantities are reasonable. We again need to think about demand equilibrium, where the expectations and the realizations match. Given the two-sided platform, finding these demand equilibria is only slightly more complicated than in the one-sided case.
We can find these points graphically by overlaying the two curves from Figure 1. Imagine that Figure 1(a) is on a transparent piece of plastic, flip it over so that the QBx axis becomes the vertical axis, and QA the horizontal axis, then lay it on top of Figure 1(b). That's what is shown in Figure 2.1
To identify the demand equilibria, look at where the two curves intersect. At these intersection points the number actually demanded by readers (given some expected number of authors) matches the number of readers that the authors expect. Likewise, the actual number demanded by authors (given that expected number of readers) matches what the readers expect. At these demand equilibria, neither the authors nor the readers have any reason to change their expectations, because their expectations are correct.
In Figure 2, with this kind of strong network externalities, there are 3 demand equilibria. These are labeled (L) for "Low", (H) for "High", and (C). We found them in a slightly different way than for the one-sided case, but we can use them the same way.
- Figure 3: Market response to being out of demand equilibrium
-
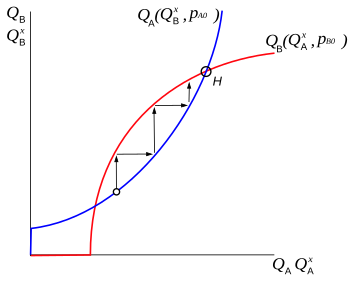 Figure 3(a)
 -
 Figure 3(b)
 -
 Figure 3(c)


Figure 3 shows three situations where the quantities are not at a demand equilibrium. When looking at single-sided network externalities, when it was out of demand equilibrium, we took separate steps: first adjust quantity demanded, then adjust expectations to match, then adjust quantity demanded, and so on. For the adjustment process here, we're showing the quantity demanded and expected quantity for readers together on the horizontal axis (QA and QAx). So, when we show an arrow for adjustment we're showing a change in the actual quantity, and just assuming that expectations follow along. Instead, the adjustment process for the two-sided platform is: side A adjusts to expectations of side B, side B adjusts to expectations of side A, and so forth.
- In Figure 3(a), at the initial point point, authors (side B) will demand more. So the first arrow shows an increase in QB (and QBx). Then, with that number of authors, readers will demand more, so the second arrow shows QA and QAx increasing. At this new level of readers, authors demand more, and so forth toward demand equilibrium (H).
- In Figure 3 (b), at the initial point, authors will demand less. So the first arrow shows a decrease in QB. At this new, lower level of authors, readers demand less, so the second arrow shows a decrease in QA, and so forth toward demand equilibrium (H).
- In Figure 3 (c), at the initial number of authors, readers will demand less. Readers and authors both decrease their quantity demanded, toward demand equilibrium (L).
 |
| Figure 4: General response to being out of demand equilibrium. |
Figure 4 gives a shorthand in arrows for the dynamics shown in Figure 3. Overall, if expectations are below (C), the market will move to demand equilibrium (L). If expectations are above (C), the market will move to demand equilibrium (H) (whether the market is originally between (C) and (H) or is greater than (H)).
Points (L), (C) and (H) are all demand equilibria, but (C) has a different character. It's an unstable equilibrium. A small shift away from (C) on the low side will send the market toward (L) and a small shift away on the high side will send the market toward (H). We'll refer to (c) as the critical mass for the market. If the market can achieve the critical mass, then it should go to the high-quantity demand equilibrium, but if it falls short of the critical mass, it will fall to the low-quantity demand equilibrium (likely with quantity demanded being zero).
Finding the demand curves edit
 |
| Figure 5: Constructing the demand curve for one side of the platform. |
In the previous section we found demand equilibria, but those are only equilibria for specific prices. We want to be able to use demand curves as we usually do in economic analysis. For this, we'll move back to having two graphs, one for each side of the market. Figure 5 shows how we can use the demand equilibria to find the demand curve for the readers. The process is the same as in the one-sided case, except that we're looking at different intersecting lines.
We hold the price for the authors (pB) constant, and choose 3 different prices for the readers: pA1, pA2 and pA3, with pA3 > pA2 > pA1. When the price goes up, the quantity-demanded curve goes down, because--at any given expected quantity--people aren't willing to buy as much. This is shown on the top graph as three curves for each of the three prices. The quantity-demanded curve for the other side of the market stays unchanged.
For each of the prices, we find the three demand equilibria: the (L), (C) and (H). The (L) in this example is always zero. It's marked with three points at pA1, pA2 and pA3. The high demand has three levels for the three different prices, HA1 at price pA1, HA2 at pA2 and HA3 at pA3. We find those levels by finding the (H) demand equilibrium for each of the three prices, and tracing it down from the top graph to the bottom demand graph. As you'd expect on any typical demand graph, higher prices give you lower quantities demanded and this part of the demand curve slopes downward.
We similarly trace the critical mass for each of the three prices, and this gives us something different looking. The critical masses are marked as CA1, CA2 and CA3. As with the one-sided case, the demand curve slopes up instead of down for the critical mass.
Using the demand curves edit
 |
| Figure 5: Demand curves for both sides of a two-sided platform. |
Besides reading the two possible quantities demanded off the demand curve, we'll need to give thought to expectations, since what consumers expect to occur can influence which of those quantities are actually realized.
Shifts in demand edit
Similar to a demand curve for a typical good, if something happens to make the network good more attractive (possibly a technology improvement), the demand curve shifts up. If something happens to make it less attractive, the demand curve shifts down. When such shifts occur, they likely will leave the (L) "low" part of the curve unchanged.
Shorthand approaches edit
Depending on the questions you have about a two-sided platform, either of two shorthand approaches might work for simpler analysis.
Shorthand as one-sided with network externalities edit
It may be that one side of the platform is where all the action is. For instance, it might be that the other side is outside the firm's strategic control. Or maybe one side is price-and-expectations-sensitive consumers and the other side is relatively few developers who can be negotiated with on individual terms. If you think that the essence of the market can be studied as if one-sided, then considering it as a one-sided market with network externalities might be a fine approach.
Shorthand as strong complements without network externalities edit
If critical mass isn't a problem, but the two sides of the market are both important to consider, then a two-sided platform can be analyzed almost like complements. Keep both sides of the market in mind, and so have two graphs, but don't worry about the upward-sloping or low-quantity sections. Instead graph as if they are standard demand curves. If the price on one side of the market goes down, that will cause the demand curve on the other side of the market to shift up.
Pricing edit
Notes edit
^1 Again, remember that this is being shown in a general, abstract fashion. It's quite possible that one inch on the horizontal axis equals 100,000 readers while one inch on the vertical axis equals 2,000 authors.</ref> On this combined graph the horizontal axis shows both the expected and realized number of readers, and the vertical axis shows both the expected and realized number of authors.
References edit
- ↑ Evans, David S.; Noel, Michael (2005). "Defining Antitrust Markets When Firms Operate Two-Sided Platforms". Columbia Business Law Review. HeinOnline: 667.
- ↑ http://www.metafilter.com/95152/Userdriven-discontent#3256046