File:Typical Signal Schedule and Traffic Flow Diagram, North-South across Market (1929).png

Size of this preview: 800 × 496 pixels. Other resolutions: 320 × 198 pixels | 640 × 397 pixels | 1,024 × 635 pixels | 1,280 × 793 pixels | 2,560 × 1,587 pixels | 4,408 × 2,732 pixels.
Original file (4,408 × 2,732 pixels, file size: 3.32 MB, MIME type: image/png)
|
|
This is a file from the Wikimedia Commons |
.png)
Summary
| Description |
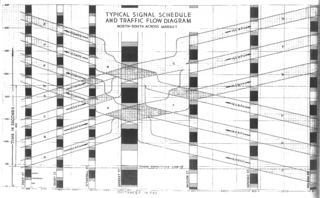
English: Typical Signal Schedule and Traffic Flow Diagram, North-South across Market (1929)
From Signal Timing Schedule for Traffic Control Plan, June 15, 1929. Attempted "green wave": 8.5mph on Market; 50 vara district: 10.5 mph north-south, 14.5 mph east-west; 100 vara district: 14.5mph north-south, 20.5mph east-west. |
| Date | |
| Source | Public domain (via Eric Fischer) |
| Author | City of San Francisco |
Licensing
This file is licensed under the Creative Commons Attribution-Share Alike 3.0 Unported license.
- You are free:
- to share – to copy, distribute and transmit the work
- to remix – to adapt the work
- Under the following conditions:
- attribution – You must give appropriate credit, provide a link to the license, and indicate if changes were made. You may do so in any reasonable manner, but not in any way that suggests the licensor endorses you or your use.
- share alike – If you remix, transform, or build upon the material, you must distribute your contributions under the same or compatible license as the original.
File history
Click on a date/time to view the file as it appeared at that time.
| Date/Time | Thumbnail | Dimensions | User | Comment | |
|---|---|---|---|---|---|
| current | 18:38, 13 August 2014 | | 4,408 × 2,732 (3.32 MB) | DavidLevinson | User created page with UploadWizard |
File usage
The following page uses this file:
Global file usage
The following other wikis use this file:
- Usage on en.wikipedia.org
- Usage on pl.wikipedia.org
- Usage on tr.wikipedia.org
.png)