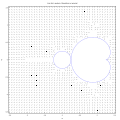
File:Scalar field, potential of Mandelbrot set.svg

Size of this PNG preview of this SVG file: 600 × 600 pixels. Other resolutions: 240 × 240 pixels | 480 × 480 pixels | 768 × 768 pixels | 1,024 × 1,024 pixels | 2,048 × 2,048 pixels | 1,000 × 1,000 pixels.
Original file (SVG file, nominally 1,000 × 1,000 pixels, file size: 30 KB)
|
|
This is a file from the Wikimedia Commons |
Summary
| DescriptionScalar field, potential of Mandelbrot set.svg |
English: Scalar field: potential of Mandelbrot set |
| Date | |
| Source | Own work |
| Author | Adam majewski |
| Other versions |
|
Licensing
I, the copyright holder of this work, hereby publish it under the following license:
This file is licensed under the Creative Commons Attribution-Share Alike 4.0 International license.
- You are free:
- to share – to copy, distribute and transmit the work
- to remix – to adapt the work
- Under the following conditions:
- attribution – You must give appropriate credit, provide a link to the license, and indicate if changes were made. You may do so in any reasonable manner, but not in any way that suggests the licensor endorses you or your use.
- share alike – If you remix, transform, or build upon the material, you must distribute your contributions under the same or compatible license as the original.
Maxima CAS src code
/*

Batch file for Maxima CAS
save as a o.mac
run maxima :

 maxima

and then :

batch("quiver_plot.mac");


Potential(0.5624000299307079*%i+0.3023655896056563 );

 =
    0.5624000299307079*%i+(0.5624000299307079*%i
                          +(0.5624000299307079*%i
                           +(0.5624000299307079*%i
                            +(0.5624000299307079*%i
                             +(0.5624000299307079*%i
                              +(0.5624000299307079*%i
                               +(0.5624000299307079*%i
                                +(0.5624000299307079*%i
                                 +(0.5624000299307079*%i
                                  +(0.5624000299307079*%i
                                   +(0.5624000299307079*%i
                                    +(0.5624000299307079*%i
                                     +(0.5624000299307079*%i
                                      +(0.5624000299307079*%i
                                       +(0.5624000299307079*%i
                                        +(0.5624000299307079*%i
                                         +(0.5624000299307079*%i
                                          +(0.5624000299307079*%i
                                           +(0.5624000299307079*%i
                                            +(0.5624000299307079*%i
                                             +(0.5624000299307079*%i
                                              +(0.5624000299307079*%i
                                               +(0.5624000299307079*%i
                                                +(0.5624000299307079*%i
                                                 +(0.5624000299307079*%i
                                                  +(0.5624000299307079*%i
                                                   +(0.5624000299307079*%i
                                                    +(0.5624000299307079*%i
                                                     +(0.5624000299307079*%i
                                                      +(0.5624000299307079*%i
                                                       +(0.5624000299307079*%i
                                                        +(0.5624000299307079
                                                         *%i

*/


kill(all);
remvalue(all);
ratprint:false; /*  It doesn't change the computing, just the warnings. */
display2d:false;
numer: true;


/* functions */


/*
converts complex number z = x*y*%i
to the list in a draw format:
[x,y]
*/

d(z):=[float(realpart(z)), float(imagpart(z))]$


log2(x) :=  float(log(x) / log(2))$


/*
 point of the unit circle D={w:abs(w)=1 } where w=l(t)
 t is angle in turns
 1 turn = 360 degree = 2*Pi radians
*/
give_unit_circle_point(t):= float(rectform(%e^(%i*t*2*%pi)))$

/* circle points */
give_circle_point(center, Radius, t) := float(rectform(center + Radius*give_unit_circle_point(t)))$


/*


(scalar) potential

https://en.wikibooks.org/wiki/Fractals/Iterations_in_the_complex_plane/MandelbrotSetExterior#Complex_potential
real potential
potential =  log(modulus)/2^iterations


complex quadratic polynomial
https://en.wikipedia.org/wiki/Complex_quadratic_polynomial

*/
Potential(c):= block(
	[i, iMax, z, ER, n,t],


	z:0,
   	i:0,
   	iMax : 1000,
   	n:1,
   	ER:1000,
   	t: cabs(z),

   	while  i< iMax  and t< ER
    		do
    		( 	/* print("i = ", i, "z = ", z), */
      			z : z*z+c, /* complex quadratic polynomial */
      			z :float(rectform(z)), /* Maxima encountered a Lisp error:  Condition in MACSYMA-TOP-LEVEL [or a callee]: INTERNAL-SIMPLE-ERROR: Bind stack overflow. */

      			t : cabs(z),
      			n : n*2,
     	 		i : i+1
    		),
    	/* print("from Potential t = ", t),	*/

    	if floatnump(t) and t>0 and i<iMax
    		then t : log2(t)/n /* exterior = escaping */
    		else t : 0, /* interior  and non escaping */
    	return (t)

)$


/*
P(x+y*%i):=Potential(x+y*%i)$

*/


/*
numerical aproximation of the potential ( scalar funtion)  gradient
on the parameter plane ( c-plane)
https://en.wikipedia.org/wiki/Complex_quadratic_polynomial#Parameter_plane

https://commons.wikimedia.org/wiki/File:Gradient_of_potential.svg

input:
* n = number of points (on the circle) to check


Gradient vector can be descibed by the
* target point cMax. When the origin of the vector is known  then target point describes the gradient vector


output is a complex point cMax
* on the circle with center = Center and radius = Radius
*
--------------
GradientPoint(0,0.1,2);

Unrecoverable error: bind stack overflow.
Przerwane
solved : if pCenter=0 then return (Center),

---------------------------------

*/

GradientPoint(Center, Radius, n) := block(

	[
		pCenter,
		p,
		dp , /* finite difference of potential between center and circle point  */
		dpMax, /* max dp */
		c, /* point on the circle */
		cMax, /* c : dp = dpMax */
		t, /* angle in turns */
		tMax,
		dt /* angle step */

	],

	/* */
	pCenter : Potential(Center),
	/* print("pCenter = ", pCenter),*/
	if is(pCenter=0)
		then (
			/* print("pCenter=0"),*/
			return (Center) /* magnitude of gradient vector is 0 inside M set. It removes stack error  */
			),

	dpMax : 0,
	dt : 1/n,
	cMax : Center, /* in case when Center is in the interior */


	t : 0, /* start with t=0 ; it can be modified to start with previous direction ??? */

	while (t < 1) do ( /* compute values (of c and dp) for all points on the circle, it can be modified to search in increasing direction and stop when decreasing  */
		c : give_circle_point(Center, Radius,t),
		/* print ("c = ", c), */
		p : Potential(c),
		/* print("p= ", p),  */
		dp : p - pCenter, /* https://en.wikipedia.org/wiki/Finite_difference#Relation_with_derivatives */

		if (dp > dpMax) then (
					dpMax : dp,
					cMax : c,
					tMax : t
				),


		t : t + dt
	),


	/* knowing good direction one can check 2 more points around tMax: */

	/* first point : tMax + dt/2 */
	c :  give_circle_point(Center, Radius,tMax + dt/2),
	p : Potential(c),
	dp : p - pCenter, /* https://en.wikipedia.org/wiki/Finite_difference#Relation_with_derivatives */

	if (dp > dpMax) then  (
				dpMax : dp,
				cMax : c,
				tMax : t
				),

	/* second point tMax -dt/2 */
	c : give_circle_point(Center, Radius,tMax - dt/2),
	p : Potential(c),
	dp : p - pCenter, /* https://en.wikipedia.org/wiki/Finite_difference#Relation_with_derivatives */
	if (dp > dpMax) then  (
				dpMax : dp,
				cMax : c,
				tMax : t
				),


	return(cMax)


)$


/*

gives vector from c1 to c2

width = dp


using:
from draw package :
vector([x, y], [dx,dy])

http://maxima.sourceforge.net/docs/manual/maxima_52.html#Item_003a-vector
plots vector
* with width [dx, dy]
* with origin in [x, y].


 */


give_vector(c1, c2 ):=block(
	[x,y,dx,dy ],


	x: realpart(c1),
	y: imagpart(c1),
	/*
	length =  cabs(c2-c1)
	angle is direction from c1 to c2
	*/
	dx : realpart(c2) - x,
	dy : imagpart(c2) - y,

	s : vector([x, y], [dx,dy])


)$


/*

return list of complex points z
*/
GiveGridList(xMin, xMax, ixMax, yMin, yMax, iyMax):=block(
	[xx, dx, x_step,
	 yy, dy, y_step,
	 GridList, z],

	dx : xMax - xMin,
	x_step : dx/ixMax,
	dy : yMax - yMin,
	y_step : dy/iyMax,

	GridList : [],
	xx : makelist(xMin+i*x_step, i, 0, ixMax ), /* list length = iMax+1 */
	yy : makelist(yMin+i*y_step, i, 0, iyMax ), /* list length = iMax+1 */


	for iy : 1 thru length(yy) step 1 do
		for ix : 1 thru length(xx) step 1 do
			(
				z : xx[ix]+yy[iy]*%i,
				GridList : endcons(z, GridList)
			),


	return(GridList)
)$


/*
input :
* cc = list of complex points
* Radius =
* n =
output : list of vectors for draw package
*/

GiveVectors(cc, Radius, n):= block (
	[g, v, vv],
	vv:[],
	for c in cc do (
		/* print("c = ", c),*/
		g : GradientPoint(c, Radius, n),
		/*print("g = ", g),*/
		if g#c
			then (	v : give_vector(c, g),
				vv : cons(v, vv)
				)

	),
	return (vv)


)$

/*  ====================================  ===================================*/

NumberOfSteps : 42;

/* world coordinate, note that  dx = dy   */
xMin : -2.5 $
xMax :  0.5 $
dx: xMax - xMin$

yMin : -1.5 $
yMax :  1.5 $
dy : yMax - yMin$

/* for screen coordinate see dimensions  */


NumberOfVectors : 100$

Radius : (xMax - xMin)/(2*NumberOfSteps)$


cc : GiveGridList(xMin, xMax,NumberOfSteps, yMin, yMax, NumberOfSteps)$


/* */
potential_list : map(Potential, cc)$
potential_array : make_array(flonum, NumberOfSteps+1, NumberOfSteps+1)$ /* 2d array */
potential_array : fillarray (potential_array, potential_list )$
arrayinfo(potential_array);
potential_matrix: genmatrix(potential_array,NumberOfSteps,NumberOfSteps)$


dd : map(d,cc)$ /* convert grid points to draw format */


vv : GiveVectors(cc, Radius, NumberOfVectors )$


/* strings */
path:"~/c/mandel/p_e_angle/trace_last/test5/q/q2/"$ /*  if empty then file is in a home dir , path should end with "/" */
FileName:  string(NumberOfSteps)$

load(draw)$
/* http://riotorto.users.sourceforge.net/Maxima/gnuplot/index.html */


draw2d(
	terminal      = svg,
	file_name = sconcat(path, FileName, "_a"),

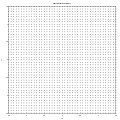
	title = "grid points of rectangular mesh",
	dimensions = [1000, 1000],
	xlabel     = "cx ",
  	ylabel     = "cy",


	point_type = filled_circle,
	point_size    =  0.5,
	color = black,
	key = "",
	points(dd)

)$


draw2d(

	terminal      = svg,
	file_name = sconcat(path, FileName,"_b"),

	title = "Scalar field: potential of Mandelbrot set",
	dimensions = [1000, 1000],
	xlabel     = "cx ",
  	ylabel     = "cy",

	image(potential_matrix,xMin,yMin, dx, dy)
	)$


draw2d(
	terminal      = svg,
	file_name = sconcat(path, FileName,"_c"),

	title = "Vetor field : gradient of Mandelbrot set potential",
	dimensions = [1000, 1000],
	xlabel     = "cx ",
  	ylabel     = "cy",
	nticks        = 200,
	key = "",

	/* key="main cardioid", */
	parametric( cos(t)/2-cos(2*t)/4, sin(t)/2-sin(2*t)/4, t,-%pi,%pi),
	/* key="period 2 component", */
	parametric( cos(t)/4-1, sin(t)/4, t,-%pi,%pi),

	head_length = Radius/10,
	color = black,

	vv
)$
Captions
Add a one-line explanation of what this file represents
Items portrayed in this file
depicts
some value
18 August 2018
File history
Click on a date/time to view the file as it appeared at that time.
| Date/Time | Thumbnail | Dimensions | User | Comment | |
|---|---|---|---|---|---|
| current | 21:03, 18 August 2018 |  | 1,000 × 1,000 (30 KB) | Soul windsurfer | User created page with UploadWizard |
File usage
The following page uses this file:
Metadata
This file contains additional information, probably added from the digital camera or scanner used to create or digitize it.
If the file has been modified from its original state, some details may not fully reflect the modified file.
| Short title | Gnuplot |
|---|---|
| Image title | Produced by GNUPLOT 5.3 patchlevel 0 |
| Width | 1000 |
| Height | 1000 |


