File:LogisticMap BifurcationDiagram.png

Size of this preview: 800 × 566 pixels. Other resolutions: 320 × 226 pixels | 640 × 453 pixels | 1,024 × 724 pixels | 1,280 × 905 pixels | 1,838 × 1,300 pixels.
Original file (1,838 × 1,300 pixels, file size: 571 KB, MIME type: image/png)
|
|
This is a file from the Wikimedia Commons |
Summary
| Description |
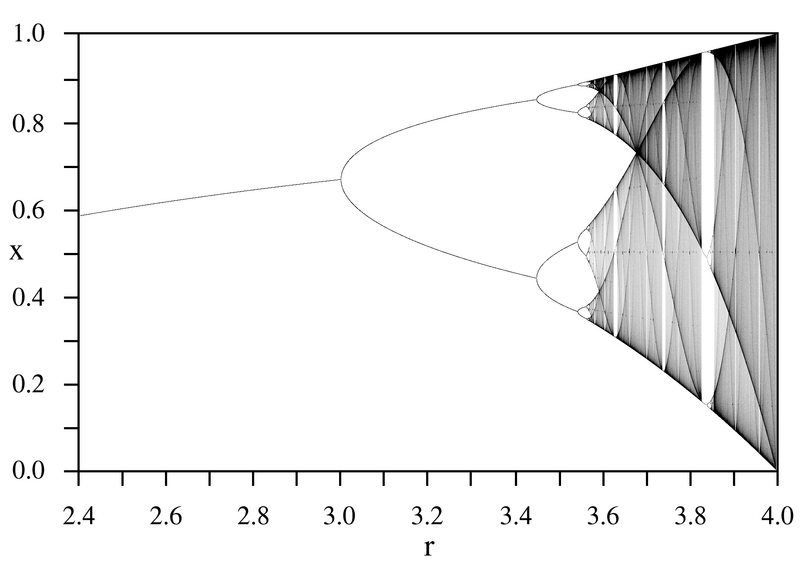
English: A bifurcation diagram for the Logistic map:
|
| Date | |
| Source | Own work |
| Author | PAR |

Licensing
| I, the copyright holder of this work, release this work into the public domain. This applies worldwide. In some countries this may not be legally possible; if so: I grant anyone the right to use this work for any purpose, without any conditions, unless such conditions are required by law. |

|
This image could be re-created using vector graphics as an SVG file. This has several advantages; see Commons:Media for cleanup for more information. If an SVG form of this image is available, please upload it and afterwards replace this template with
{{vector version available|new image name}}.
It is recommended to name the SVG file “LogisticMap BifurcationDiagram.svg”—then the template Vector version available (or Vva) does not need the new image name parameter. |
File history
Click on a date/time to view the file as it appeared at that time.
| Date/Time | Thumbnail | Dimensions | User | Comment | |
|---|---|---|---|---|---|
| current | 00:11, 14 September 2005 | | 1,838 × 1,300 (571 KB) | PAR~commonswiki | Bifurcation diagram for the logistic map for parameter r=2.4 to 4.0. |
File usage
The following page uses this file:
Global file usage
The following other wikis use this file:
- Usage on ar.wikipedia.org
- Usage on ca.wikipedia.org
- Usage on da.wikipedia.org
- Usage on de.wikipedia.org
- Usage on el.wikipedia.org
- Usage on en.wikipedia.org
- Talk:Bifurcation diagram
- Talk:Logistic map
- Mitchell Feigenbaum
- Portal:Mathematics/Featured picture archive
- Recurrence quantification analysis
- Portal:Mathematics/Suggestions
- Wikipedia:WikiProject Systems/List of images of systems
- User:Kiefer.Wolfowitz
- Wikipedia talk:WikiProject Mathematics/Archive/2011
- Ivar Ekeland
- Wikipedia talk:WikiProject Mathematics/Archive/2011/Apr
- User talk:Kiefer.Wolfowitz/Archive 9
- Portal:Mathematics/Featured picture/2011 12
- User:RazrRekr201/Table of constants
- Mathematical constant
- Usage on en.wikiversity.org
- Usage on eo.wikipedia.org
- Usage on es.wikipedia.org
- Usage on fi.wikipedia.org
- Usage on fr.wikipedia.org
- Usage on fr.wikiversity.org
- Usage on he.wikipedia.org
- Usage on hi.wikipedia.org
View more global usage of this file.