File:Density of ice and water (en).svg

Size of this PNG preview of this SVG file: 573 × 379 pixels. Other resolutions: 320 × 212 pixels | 640 × 423 pixels | 1,024 × 677 pixels | 1,280 × 847 pixels | 2,560 × 1,693 pixels.
Original file (SVG file, nominally 573 × 379 pixels, file size: 323 KB)
|
|
This is a file from the Wikimedia Commons |
Summary
| Description |
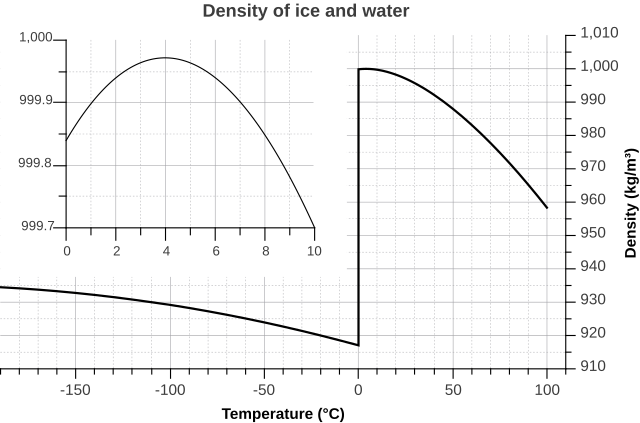
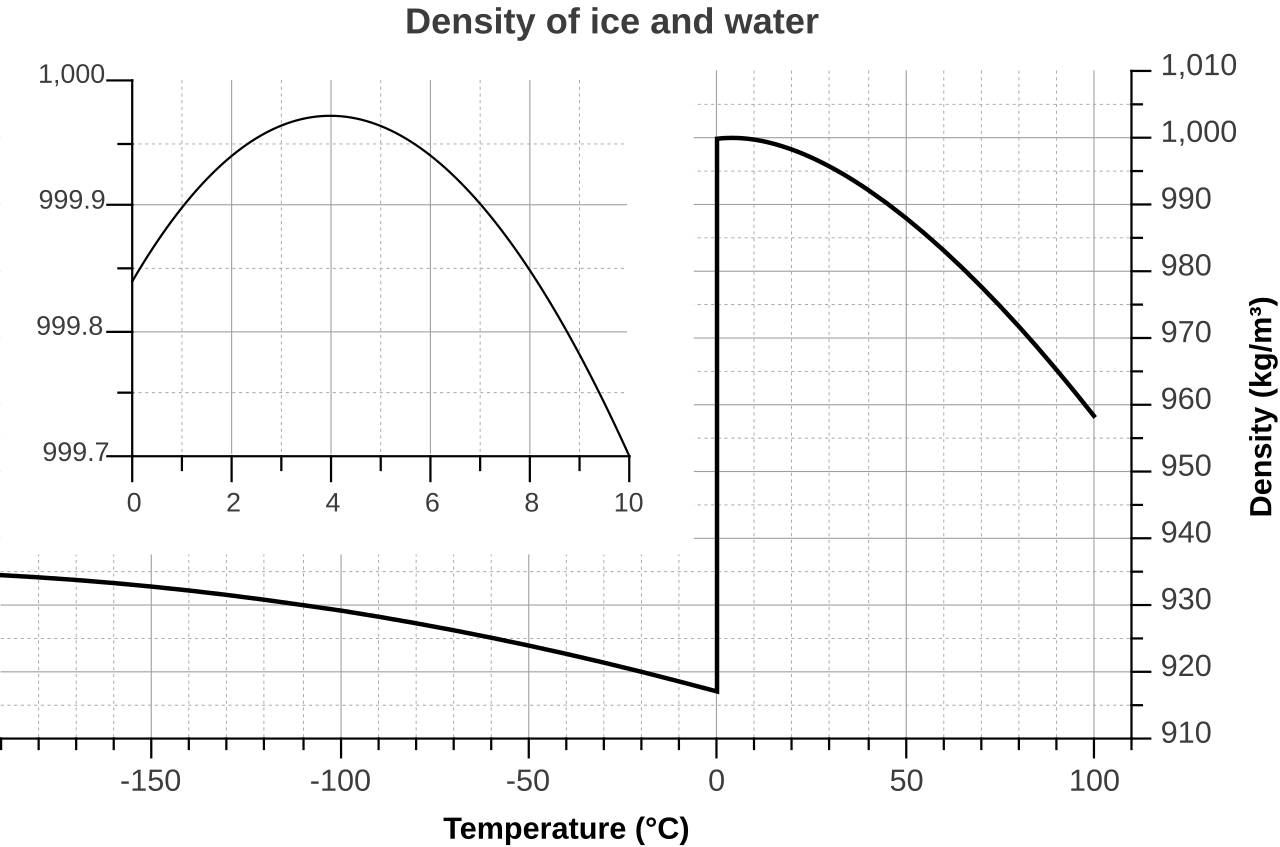
English: Density of ice and water as a function of temperature Deutsch: Dichte von Eis und Wasser in Abhängigkeit von der Temperatur |
| Date | |
| Source | Own work |
| Author | Klaus-Dieter Keller, created with QtiPlot, Font: Liberation Sans |
| Other versions |
|
.svg)
.svg)
.svg)

.svg)
Licensing
I, the copyright holder of this work, hereby publish it under the following license:
This file is licensed under the Creative Commons Attribution-Share Alike 3.0 Unported license.
- You are free:
- to share – to copy, distribute and transmit the work
- to remix – to adapt the work
- Under the following conditions:
- attribution – You must give appropriate credit, provide a link to the license, and indicate if changes were made. You may do so in any reasonable manner, but not in any way that suggests the licensor endorses you or your use.
- share alike – If you remix, transform, or build upon the material, you must distribute your contributions under the same or compatible license as the original.
Data
- Ice: Chapter 3.22d of http://www.ptb.de/cms/fileadmin/internet/publikationen/buecher/Kohlrausch/Tabellen/Kohlrausch_3_Tabellen_und_Diagramme_Waerme.pdf
-180;934
-150;933
-120;931
-100;929
-80;927
-60;925
-40;923
-20;920
0;917
0;999.840
1;999.899
2;999.940
3;999.964
4;999.972
5;999.964
6;999.940
7;999.902
8;999.848
9;999.781
10;999.700
11;999.6
12;999.5
13;999.38
14;999.24
15;999.1
16;998.94
17;998.77
18;998.59
19;998.4
20;998.2
21;997.99
22;997.77
23;997.54
24;997.29
25;997.04
26;996.78
27;996.51
28;996.23
29;995.94
30;995.64
31;995.34
32;995.02
33;994.7
34;994.37
35;994.03
36;993.68
37;993.32
38;992.96
39;992.59
40;992.21
45;990.21
50;988.03
55;985.69
60;983.19
65;980.55
70;977.76
75;974.84
80;971.79
85;968.61
90;965.3
95;961.88
100;958.35
File history
Click on a date/time to view the file as it appeared at that time.
| Date/Time | Thumbnail | Dimensions | User | Comment | |
|---|---|---|---|---|---|
| current | 01:32, 14 February 2018 | | 573 × 379 (323 KB) | Geek3 | More precise data now from virial expansion |
| 00:49, 14 February 2018 |  | 573 × 379 (323 KB) | Geek3 | The plot lines were jagged due to a strange interpolation of coarsly rounded data points. Now the data is quadratically interpolated, which yields a smooth plot curve while staying within the accuracy of the underlying data points. | |
| 15:07, 15 April 2012 |  | 573 × 379 (329 KB) | Kdkeller | Problems solved with the linux fonts | |
| 14:47, 15 April 2012 |  | 573 × 379 (120 KB) | Kdkeller | cropped the transparent border | |
| 13:58, 15 April 2012 |  | 590 × 390 (120 KB) | Kdkeller |
File usage
The following page uses this file:
Global file usage
The following other wikis use this file:
- Usage on ca.wikipedia.org
- Usage on en.wikipedia.org
- Usage on fa.wikipedia.org
- Usage on fr.wikipedia.org
- Usage on pt.wikipedia.org
- Usage on www.wikidata.org
- Usage on zh.wikipedia.org
.svg)