File:Damping 1.svg

Size of this PNG preview of this SVG file: 650 × 356 pixels. Other resolutions: 320 × 175 pixels | 640 × 351 pixels | 1,024 × 561 pixels | 1,280 × 701 pixels | 2,560 × 1,402 pixels.
Original file (SVG file, nominally 650 × 356 pixels, file size: 69 KB)
|
|
This is a file from the Wikimedia Commons |
Summary
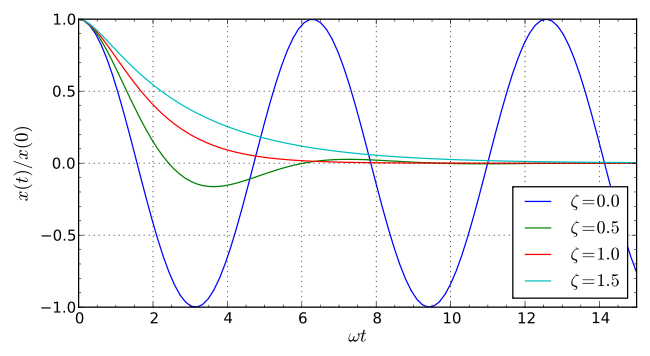
| Description | |
| Date | 20 September 2007 (original upload date) |
| Source |
Transferred from en.wikipedia; transferred to Commons by Kropotkine 113 using CommonsHelper. |
| Author |
Nuno Nogueira. Original uploader was Nmnogueira at en.wikipedia. Later version(s) were uploaded by Dicklyon at en.wikipedia. |
| Other versions |
|
| SVG development | |
| Source code | MATLAB code%Uses the files from Matlab Central File Exchange "plot2svg"
clear all
t = 0:0.01:11;
damping = [0.5, 1, 1.5, 0]; % damping values
colors = {'b', [0, 0.7, 0], 'r', 'm'};
h_fig = figure;
set(h_fig, 'Position',[360 673 354 249])
h_axes = axes;
axis([0, t(end), -1.05, 1.05]);
xlabel('time(s)')
ylabel('x/x0')
hold on
omega_0 = 1; % natural frequency
for k = 1:length(damping)
gamma = damping(k) * omega_0;
if damping(k) > 1 % over-damped
gamma1 = gamma - sqrt(gamma^2 - omega_0^2);
gamma2 = gamma + sqrt(gamma^2 - omega_0^2);
x = (gamma2 * exp(-gamma1 * t) - gamma1 * exp(-gamma2 * t)) / (gamma2 - gamma1);
else
if damping(k) == 1 % critically damped
x = (1 + gamma * t) .* exp(-gamma * t);
else % under-damped
omega_prime = sqrt(omega_0^2 - gamma^2);
alpha = atan(gamma / omega_prime);
x = exp(-gamma*t) .* cos(omega_prime * t - alpha) / cos(alpha);
end
end
plot(t, x, 'Color', colors{k}, 'LineWidth', 1)
end
plot([0; t(end)], [0; 0], 'k')
legend('\zeta < 1', '\zeta = 1', '\zeta > 1', '\zeta = 0')
hold off
plot2svg('damping.svg',h_fig)
|
Licensing
Nmnogueira at en.wikipedia, the copyright holder of this work, hereby publishes it under the following license:
This file is licensed under the Creative Commons Attribution-Share Alike 2.5 Generic license.
Attribution: Nmnogueira at en.wikipedia
- You are free:
- to share – to copy, distribute and transmit the work
- to remix – to adapt the work
- Under the following conditions:
- attribution – You must give appropriate credit, provide a link to the license, and indicate if changes were made. You may do so in any reasonable manner, but not in any way that suggests the licensor endorses you or your use.
- share alike – If you remix, transform, or build upon the material, you must distribute your contributions under the same or compatible license as the original.
Original upload log
The original description page was here. All following user names refer to en.wikipedia.
- 2009-08-05 00:30 [[[:en:User:Dicklyon|Dicklyon]] 512×360× (87765 bytes) Hacked the axis labels to be better
- 2009-08-02 08:52 Dicklyon 512×360× (86099 bytes) Updated equations, using a book source, to match accelerations at t = 0. New code.
- 2007-09-20 16:08 Nmnogueira 200×200 (58385 bytes)
- 2007-09-20 15:59 Nmnogueira 200×200 (63244 bytes)
- 2007-09-20 15:49 Nmnogueira 200×200 (63017 bytes)
- 2007-09-20 15:43 Nmnogueira 200×200 (63865 bytes)
- 2007-09-20 15:41 Nmnogueira 200×200 (63986 bytes)
- 2007-09-20 15:40 Nmnogueira 200×200 (58391 bytes)
- 2007-09-20 15:37 Nmnogueira 200×200 (58391 bytes) {{Information| |Description = [[Damping]] |Source = Self-made using Matlab. Source code provided below. |Date = 2007-09-20 |Author = Nuno Nogueira (~~~) |Permission = {{self|cc-by-sa-2.5}} }} ==Source Code== Uses the files from Matlab Central File Exchan
File history
Click on a date/time to view the file as it appeared at that time.
| Date/Time | Thumbnail | Dimensions | User | Comment | |
|---|---|---|---|---|---|
| current | 06:37, 6 June 2011 | | 650 × 356 (69 KB) | Krishnavedala | axis labels |
| 06:31, 6 June 2011 |  | 656 × 354 (68 KB) | Krishnavedala | kept the original 'y' axis label | |
| 06:29, 6 June 2011 |  | 644 × 354 (70 KB) | Krishnavedala | updated the fonts, picture quality ,etc.. | |
| 20:32, 5 May 2010 |  | 512 × 360 (86 KB) | Kropotkine 113 | {{Information |Description={{en|en:Damping<br/> ==Source Code== Uses the files from Matlab Central File Exchange "plot2svg" <source lang="matlab"> clear all t = 0:0.01:11; damping = [0.5, 1, 1.5, 0]; % damping values colors = {'b', [0, 0.7, 0], 'r' |
File usage
The following page uses this file:
Global file usage
The following other wikis use this file:
- Usage on ar.wikipedia.org
- Usage on ary.wikipedia.org
- Usage on en.wikipedia.org
- Usage on en.wiktionary.org
- Usage on fr.wikipedia.org
- Usage on ja.wikipedia.org
- Usage on or.wikipedia.org
- Usage on pt.wikipedia.org
- Usage on simple.wikipedia.org
- Usage on uk.wikipedia.org