Using SPSS and PASW/Frequencies
Frequencies, in statistics, refers to counts of categories or responses. It's a basic statistical tool that provides a sense of how often specific response options occur in a population.
Using the sample data set, let's say we want to know the geographic distribution of genetic counselors. Fortunately, in the sample data set, there is a variable, "region", that in combination with the Frequencies function in SPSS, will tell us what we want to know.
Let's begin. Click "Analyze" -> "Descriptive Statistics" -> "Frequencies":

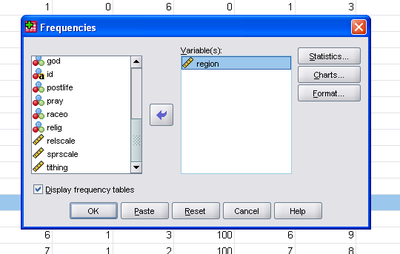
The "Frequencies" window will appear:

Scroll through the variables until you find the variable you want. In our example, we're interested in "region", so click the arrow to move that variable into the "Variable(s):" box:

Then make sure that the "Display frequency tables" box is checked and click "OK". In the Output Window you should see

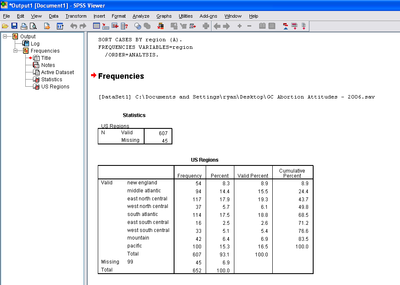
Note that there are two tables in this output. The first breaks down the frequency of valid region data versus missing. The second table shows frequency distribution with four labeled columns.
The first, labeled "Frequency", simply reports the number of cases that fall into each category of the variable being analyzed. E.g., exactly 100 of our genetic counselors live in the "pacific" region.
The second column, "Percent", provides a percentage of the total cases that fall into each region. The percentage of genetic counselors of the total that we know work in the "pacific" region is 15.3%.
The third column, labeled "Valid Percent," is a percentage that does not include missing cases. Without them, "pacific" region's share increases to 16.5%.
The fourth column, "Cumulative Percent", adds the percentages of each region from the top of the table to the bottom, culminating in 100%. This is more useful when the variable of analysis is ranked or ordinal, as it makes it easy to get a sense of what percentage of cases fall below each rank.
We hope this provides a sense of the utility of SPSS' Frequencies calculation.