File:Two Slit Interference, 2500nm wl, 0.1mm d, close up.png

Size of this preview: 800 × 400 pixels. Other resolutions: 320 × 160 pixels | 640 × 320 pixels | 1,000 × 500 pixels.
Original file (1,000 × 500 pixels, file size: 380 KB, MIME type: image/png)
|
|
This is a file from the Wikimedia Commons |
| Description |
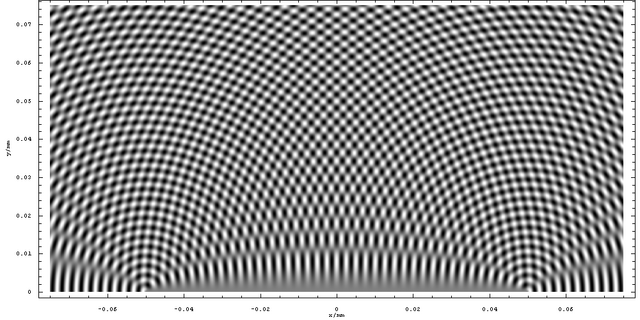
English: Density plot of two slit interference of 800nm light thtrough slits 0.1mm apart. The equation is:
where
|
||
| Date | |||
| Source | Own work | ||
| Author | Inductiveload | ||
| Permission (Reusing this file) |
|

Mathematica Code
lambda = 2500*10^-9;
k = 2*Pi/lambda;
d = 0.1*10^-3;

path1[x_, y_] := Sqrt[y^2 + (x + d/2)^2];
path2[x_, y_] := Sqrt[y^2 + (x - d/2)^2];
phasediff[x_, y_] := (2*Pi/lambda )*(path1[x, y] - path2[x, y])

close = DensityPlot[
      x = xmm/1000;
      y = ymm/1000;
      Evaluate[
        Sin[k *path1[x, y]] +
          Sin[k *path2[x, y]]
        ],
      {xmm, -0.075, 0.075},
      {ymm, 0, 0.075},
      PlotPoints -> 2000,
      AspectRatio -> Automatic,
      ImageSize -> 1000,
      Mesh -> False,
      FrameLabel -> {"x/mm", "y/mm"}];
File history
Click on a date/time to view the file as it appeared at that time.
| Date/Time | Thumbnail | Dimensions | User | Comment | |
|---|---|---|---|---|---|
| current | 05:50, 13 May 2009 | | 1,000 × 500 (380 KB) | Inductiveload | {{Information |Description={{en|1=Density plot of two slit interference of 800nm light thtrough slits 0.1mm apart. The equation is: <math>u(x,y,t)= \sin \left( k \sqrt{ \left( x-\frac{d}{2} \right)^2 + y^2} \right)+ \sin \left( k \sqrt{ \left( x+\frac{d}{ |
File usage
The following page uses this file: