File:R-car stopping distances 1920+linear.svg

Size of this PNG preview of this SVG file: 720 × 360 pixels. Other resolutions: 320 × 160 pixels | 640 × 320 pixels | 1,024 × 512 pixels | 1,280 × 640 pixels | 2,560 × 1,280 pixels.
Original file (SVG file, nominally 720 × 360 pixels, file size: 105 KB)
|
|
This is a file from the Wikimedia Commons |
Summary
| Description |
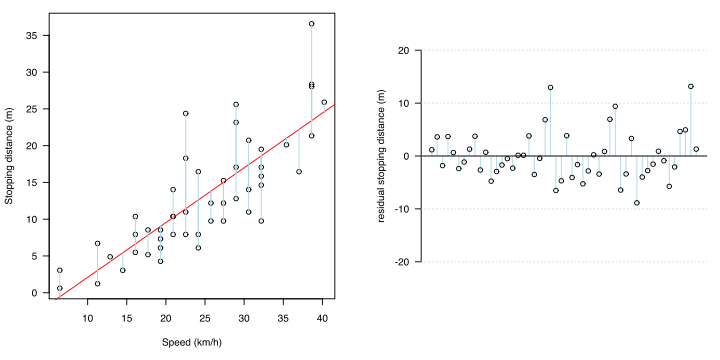
English: A graph of car stopping distances, fitted with a simple linear model (straight line) and residual plot |
| Date | |
| Source | Own work |
| Author | HYanWong |
using the following commands
svg("R-car_stopping_distances_1920+linear.svg", 8,4,8)
layout(t(1:2))

par(mar=c(5, 4, 1, 2) + 0.1)
cars$speed.kph <- cars$speed*1.609344
cars$dist.m <- cars$dist*0.3048
plot(dist.m ~ speed.kph, data=cars, xlab = "Speed (km/h)", ylab = "Stopping distance (m)", las = 1)
straight.line.model <- lm(dist.m~speed.kph, data=cars)  #This creates and stores a model ("lm" means "Linear Model").
abline(straight.line.model, col="red")     #"abline" is a simple function that plots a straight line
segments(cars$speed.kph, fitted.values(straight.line.model), cars$speed.kph,
 fitted.values(straight.line.model)+residuals(straight.line.model), col="lightblue")

par(mar=c(5, 5, 1, 1) + 0.1)
plot(residuals(straight.line.model), type="h", ylim=c(-25,25), bty="n",
 xaxt="n", las=2, xlab=NA, ylab="residual stopping distance (m)", col="lightblue")
grid(NA, NULL)
abline(h=0)
points(residuals(straight.line.model))

dev.off()
Licensing
| I, the copyright holder of this work, release this work into the public domain. This applies worldwide. In some countries this may not be legally possible; if so: I grant anyone the right to use this work for any purpose, without any conditions, unless such conditions are required by law. |
File history
Click on a date/time to view the file as it appeared at that time.
| Date/Time | Thumbnail | Dimensions | User | Comment | |
|---|---|---|---|---|---|
| current | 22:40, 19 January 2009 | | 720 × 360 (105 KB) | HYanWong | {{{Information |Description={{en|1=A graph of car stopping distances, fitted with a simple linear model (straight line) and residual plot}} |Source=Own work by uploader |Author=HYanWong |Date=2008/12/13 |Permission= |other_versions= }} |
| 21:36, 19 January 2009 |  | 360 × 360 (70 KB) | HYanWong | {{Information |Description={{en|1=A simple graph of car stopping distances, with a simple linear model (straight line) fit}} |Source=Own work by uploader |Author=HYanWong |Date=2008/12/13 |Permission= |other_versions= }} {{Created with R | |
| 10:51, 13 December 2008 |  | 360 × 360 (58 KB) | HYanWong | {{Information |Description={{en|1=A simple graph of car stopping distances, with a simple linear model (straight line) fit}} |Source=Own work by uploader |Author=HYanWong |Date=2008/12/13 |Permission= |other_versions= }} {{Created with R |
File usage
The following page uses this file: