File:Price-Earnings Ratios as a Predictor of Twenty-Year Returns (Shiller Data).png

Size of this preview: 750 × 600 pixels. Other resolutions: 300 × 240 pixels | 600 × 480 pixels | 948 × 758 pixels.
Original file (948 × 758 pixels, file size: 29 KB, MIME type: image/png)
|
|
This is a file from the Wikimedia Commons |
.png)
Summary
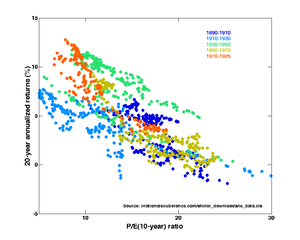
| Description | Price-Earnings Ratios as a Predictor of Twenty-Year Returns: A twenty-year modification of the plot by Robert Shiller (Figure 10.1 from Shiller, Robert (2005) Irrational Exuberance (2d ed.), Princeton University Press ISBN 0-691-12335-7) using data from irrationalexuberance.com/shiller_downloads/ie_data.xls. The horizontal axis shows the real price-earnings ratio of the S&P Composite Stock Price Index as computed in Irrational Exuberance (inflation adjusted price divided by the prior ten-year mean of inflation-adjusted earnings). The vertical axis shows the geometric average real annual return on investing in the S&P Composite Stock Price Index, reinvesting dividends, and selling twenty years later. Data from different twenty year periods is color-coded as shown in the key. See also Image:Price-Earnings Ratios as a Predictor of Ten-Year Returns (Shiller Data).png. |
| Date | |
| Source | Own work |
| Author | Stsmith |
.png)

|
This graph image could be re-created using vector graphics as an SVG file. This has several advantages; see Commons:Media for cleanup for more information. If an SVG form of this image is available, please upload it and afterwards replace this template with
{{vector version available|new image name}}.
It is recommended to name the SVG file “Price-Earnings Ratios as a Predictor of Twenty-Year Returns (Shiller Data).svg”—then the template Vector version available (or Vva) does not need the new image name parameter. |
Licensing
I, the copyright holder of this work, hereby publish it under the following licenses:

|
Permission is granted to copy, distribute and/or modify this document under the terms of the GNU Free Documentation License, Version 1.2 or any later version published by the Free Software Foundation; with no Invariant Sections, no Front-Cover Texts, and no Back-Cover Texts. A copy of the license is included in the section entitled GNU Free Documentation License. |
This file is licensed under the Creative Commons Attribution-Share Alike 4.0 International, 3.0 Unported, 2.5 Generic, 2.0 Generic and 1.0 Generic license.
- You are free:
- to share – to copy, distribute and transmit the work
- to remix – to adapt the work
- Under the following conditions:
- attribution – You must give appropriate credit, provide a link to the license, and indicate if changes were made. You may do so in any reasonable manner, but not in any way that suggests the licensor endorses you or your use.
- share alike – If you remix, transform, or build upon the material, you must distribute your contributions under the same or compatible license as the original.
You may select the license of your choice.
File history
Click on a date/time to view the file as it appeared at that time.
| Date/Time | Thumbnail | Dimensions | User | Comment | |
|---|---|---|---|---|---|
| current | 22:04, 16 February 2008 | | 948 × 758 (29 KB) | Stsmith~commonswiki | {{Information |Description=Price-Earnings Ratios as a Predictor of Twenty-Year Returns: A twenty-year modification of the plot by w:Robert Shiller (Figure 10.1 from {{cite book |last=Shiller |first=Robert |title=[[Irrational Exuberance (book)|Irration |
File usage
The following 2 pages use this file:
Global file usage
The following other wikis use this file:
- Usage on en.wikipedia.org
- Usage on fr.wikipedia.org
- Usage on ja.wikipedia.org
- Usage on ta.wikipedia.org
.png)