File:Generalized factorial function more infos.svg

Size of this PNG preview of this SVG file: 500 × 315 pixels. Other resolutions: 320 × 202 pixels | 640 × 403 pixels | 1,024 × 645 pixels | 1,280 × 806 pixels | 2,560 × 1,613 pixels.
Original file (SVG file, nominally 500 × 315 pixels, file size: 54 KB)
|
|
This is a file from the Wikimedia Commons |
Summary
| Description |
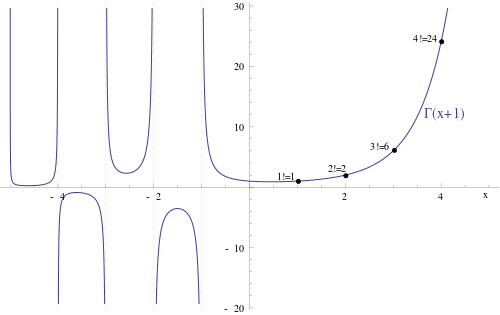
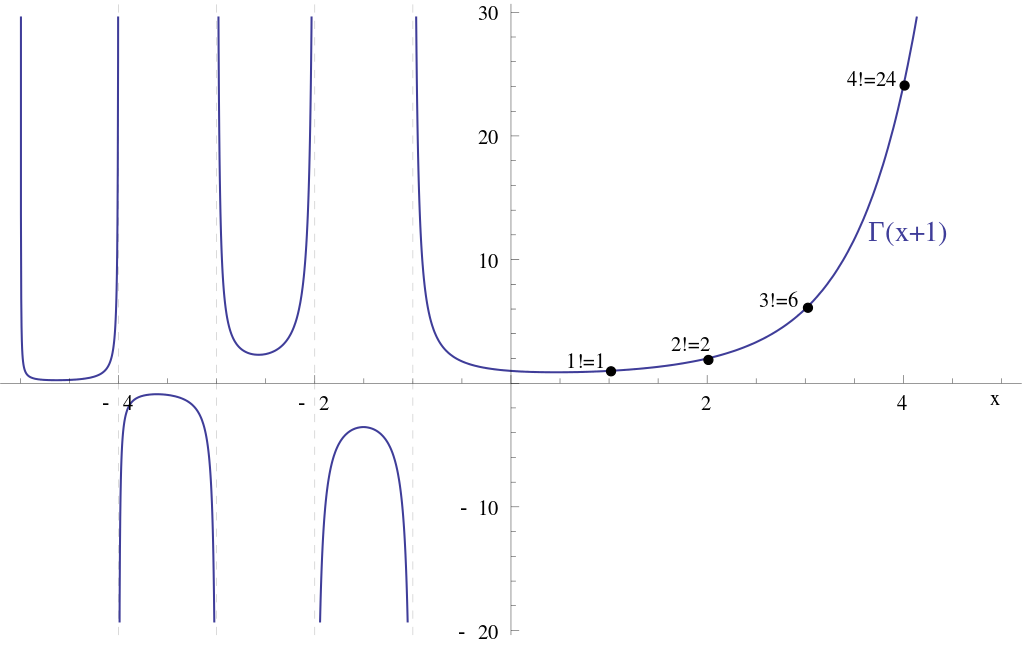
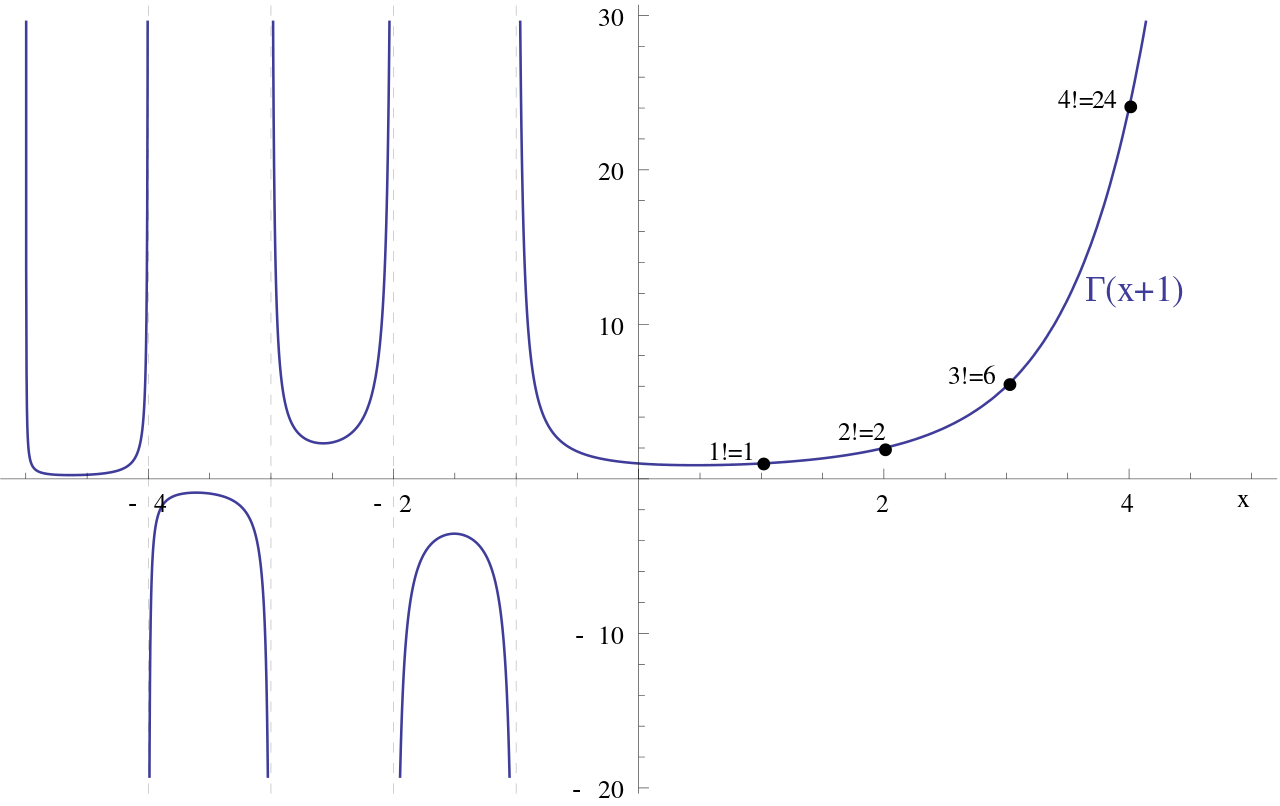
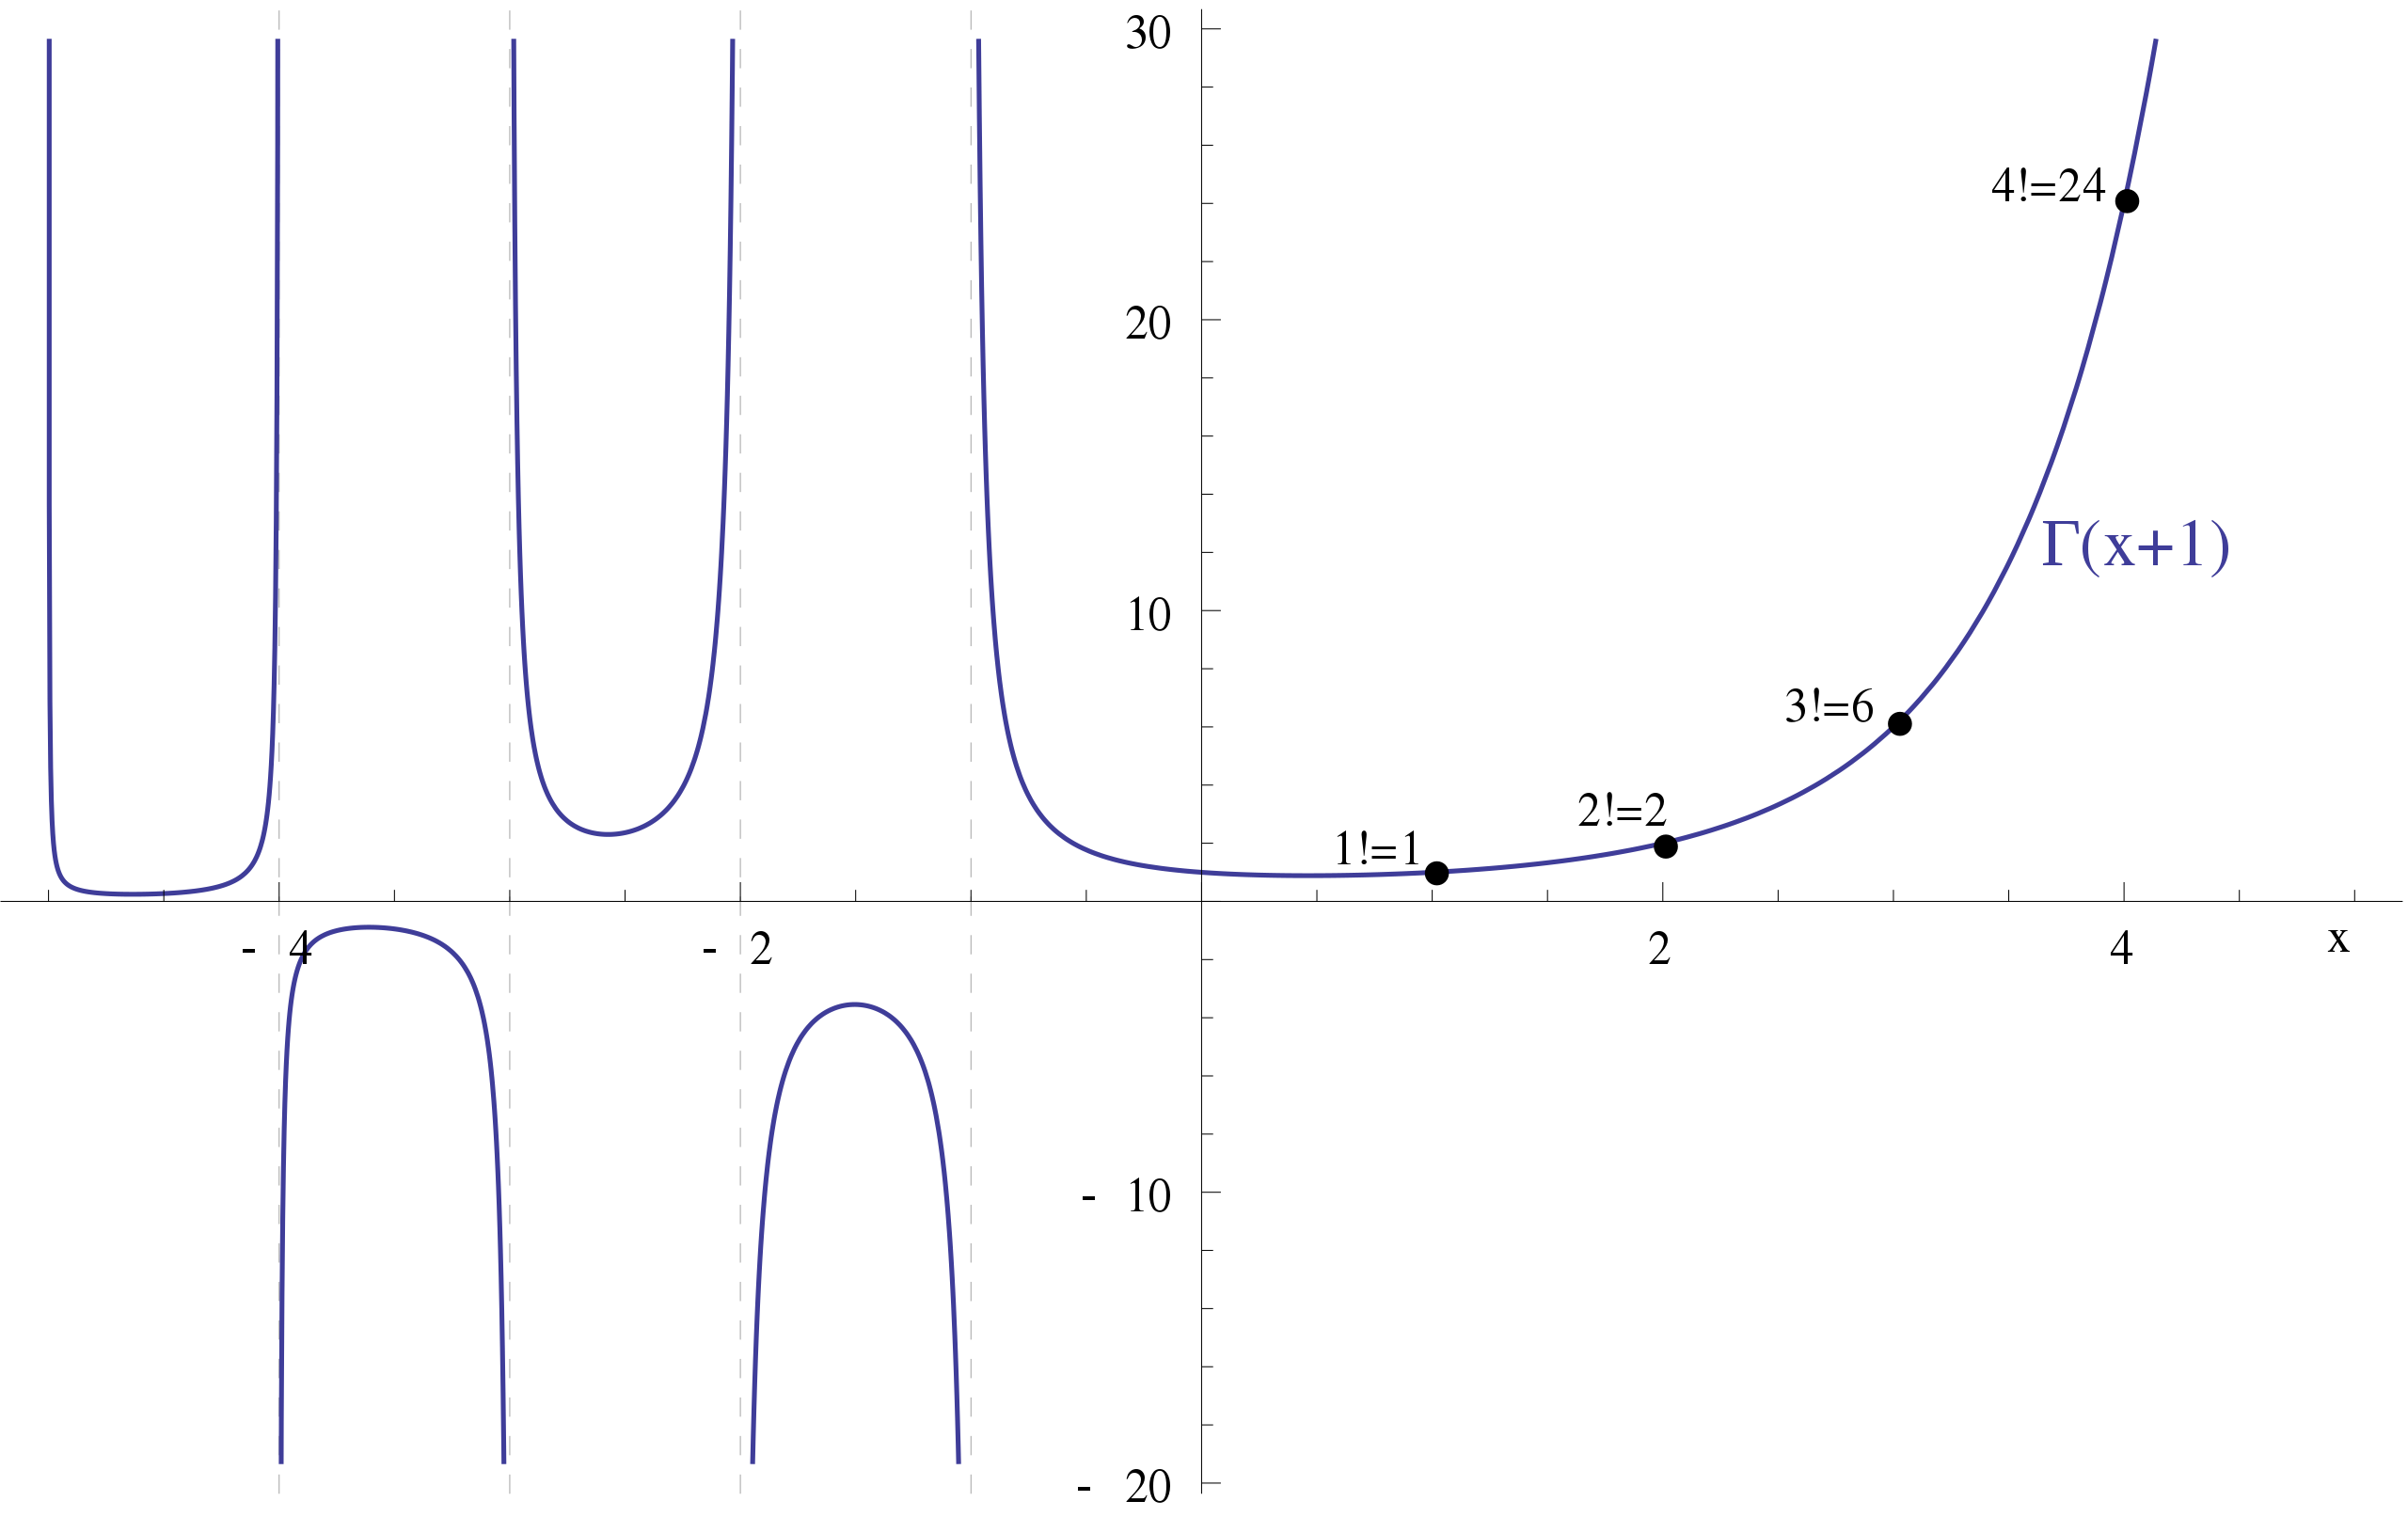
English: Plot of the generalized factorial function over the interval [-5, 5]. |
| Date | |
| Source |
|
| Author | Mathmensch based on work of Bender2k14 |
| Other versions |
|

Licensing
| This work is ineligible for copyright and therefore in the public domain because it consists entirely of information that is common property and contains no original authorship. |
File history
Click on a date/time to view the file as it appeared at that time.
| Date/Time | Thumbnail | Dimensions | User | Comment | |
|---|---|---|---|---|---|
| current | 16:08, 19 April 2014 | | 500 × 315 (54 KB) | Mathmensch | bad mistake... |
| 11:22, 19 April 2014 |  | 500 × 315 (54 KB) | Mathmensch | some more information added to the function graph |
File usage
The following 2 pages use this file:
Global file usage
The following other wikis use this file:
- Usage on en.wikipedia.org
- Usage on id.wikipedia.org